RAID Fault Tolerance Calculator
See how many drives your array can lose, whether it survives a given failure, roughly how long a rebuild takes, and the probability that an unrecoverable read error (URE) causes the rebuild itself to fail across RAID 0, 1, 5, 6, 10, 50 and 60.
🎯Real RAID Array Presets
💾Array Configuration
Each level applies its own real fault-tolerance rule.
Total member drives in the array, spares excluded.
Number of RAID 5 or 6 sub-arrays that are striped.
How many simultaneous failures to check survival for.
Per-drive size; larger drives mean longer rebuilds.
Sustained resync speed under load, often 50 to 200 MB/s.
Annualized failure rate used to estimate exposure.
Lower ratings raise the odds a rebuild read fails.
Standby drives that auto-rebuild and cut exposure time.
🔢Formula Snapshot
📋Fault Tolerance Rules by Level
| RAID Level | Drives That Can Fail | Parity Overhead | Failure Rule |
|---|---|---|---|
| RAID 0 | 0 | None | Any loss kills the array |
| RAID 1 | n minus 1 | n minus 1 mirrors | One copy must survive |
| RAID 5 | 1 | 1 drive | Single parity block |
| RAID 6 | 2 | 2 drives | Dual parity blocks |
| RAID 10 | 1 guaranteed, up to n/2 | Half of drives | One per mirror pair |
| RAID 50 | 1 per RAID 5 group | 1 per group | Any group failing 2 kills it |
| RAID 60 | 2 per RAID 6 group | 2 per group | Any group failing 3 kills it |
| JBOD | 0 | None | Independent, no protection |
⏳Rebuild Time by Drive Size and Speed
| Drive Capacity | At 50 MB/s | At 120 MB/s | At 200 MB/s |
|---|---|---|---|
| 2 TB | 11.1 h | 4.6 h | 2.8 h |
| 4 TB | 22.2 h | 9.3 h | 5.6 h |
| 8 TB | 44.4 h | 18.5 h | 11.1 h |
| 12 TB | 66.7 h | 27.8 h | 16.7 h |
| 16 TB | 88.9 h | 37.0 h | 22.2 h |
| 20 TB | 111.1 h | 46.3 h | 27.8 h |
⚠URE Rebuild-Failure Risk by Data Read
| Data Read on Rebuild | Bits Read | Risk at 1e14 | Risk at 1e15 |
|---|---|---|---|
| 2 TB | 1.76e13 | 16.1% | 1.7% |
| 6 TB | 5.28e13 | 41.1% | 5.1% |
| 12 TB | 1.06e14 | 65.3% | 10.1% |
| 24 TB | 2.11e14 | 87.9% | 19.2% |
| 48 TB | 4.22e14 | 98.5% | 34.7% |
| 96 TB | 8.45e14 | 99.9% | 57.4% |
🗃RAID Level Survivability Comparison Grid
| RAID Level | Min Drives | Drives Can Fail | Capacity Efficiency | Rebuild Risk | Recommended Use |
|---|---|---|---|---|---|
| RAID 0 | 2 | 0 | 100% | N/A (no rebuild) | Scratch, cache, temp render |
| RAID 1 | 2 | n minus 1 | 1/n | Low, direct copy | Boot and OS mirrors |
| RAID 5 | 3 | 1 | (n-1)/n | High on big SATA | Small NAS, read-heavy |
| RAID 6 | 4 | 2 | (n-2)/n | Moderate, tolerates URE | Large arrays, archives |
| RAID 10 | 4 | 1 to n/2 | 50% | Low, fast rebuild | Databases, VMs, high IOPS |
| RAID 50 | 6 | 1 per group | (n-g)/n | Moderate per group | Bulk storage, throughput |
| RAID 60 | 8 | 2 per group | (n-2g)/n | Low per group | Very large media pools |
⚙Formula Breakdown
💡RAID Survivability Tips
When a drive fails in a RAID array, you’re fine… until it doesn’t. Then you start asking: Will my array remain operational? How long will it take to rebuild? What’s the likelihood that a bad sector will cause a complete volume failure?
While most calculators measure usable capacity, they ignore actual risk. This calculator measures rebuild time, survivability and chance of unrecoverable read error. Rather than thinking about available storage space, it forces you to think about data safety as it tries be restored.
Why Your Data Is at Risk
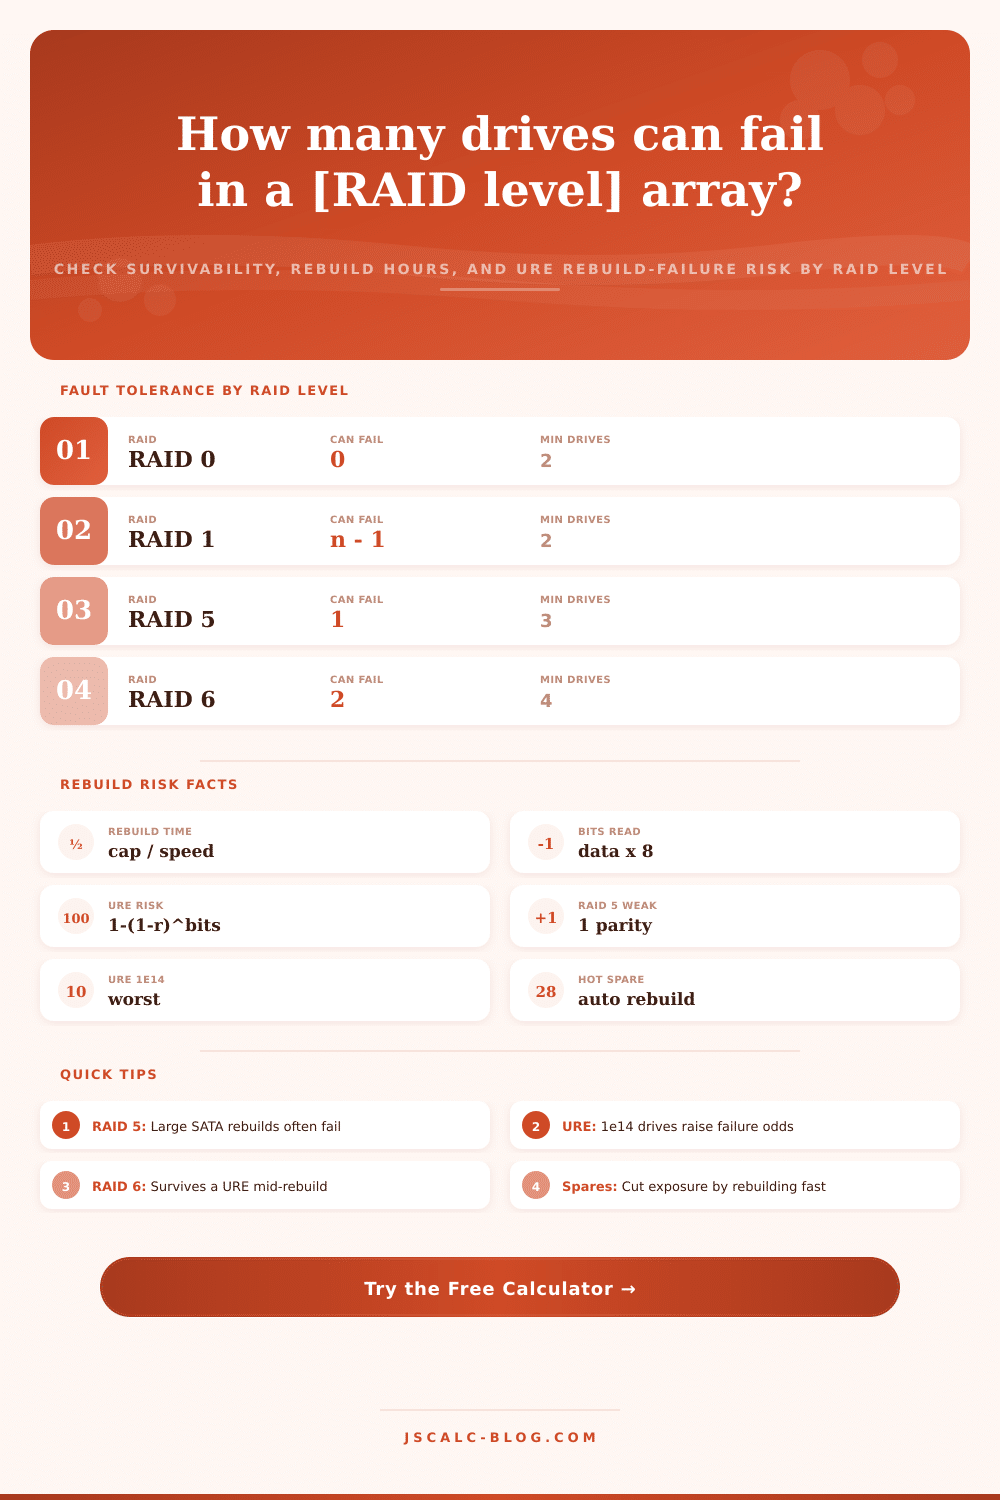
Tolerance means how many drives can fails before your data is lost. Mixing up levels gives you false confidence here too. You can stripe without redundancy (RAID 0), and this configuration tolerates no failures. So if you lose one drive, bye-bye array.
You can mirror (RAID 1) across drives, in which case you survive till you have just one copy. This means it’s robust for a boot volume (n minus 1) but expensive for storage efficiency.
Next is RAID 5, which distributes a single parity block and will tolerate exactly one failure. Then there’s RAID 6, with a second parity block and tolerant of two. The calculator let you enter how many drives and which RAID level you are using to clearly show these numbers.
The nesting levels don’t act the same way and there’s some subtlety involved in how survivable they are. RAID 10 mirrors sets and then stripes them. That means that it is guaranteed to survive one failure and will survive up to half the drives, so long as neither mirror fails both disks. (That translates into one disk is guaranteed to fail and up to n divided by two may fail.)
RAID 50 or 60 groups together levels for an interesting twist. Call it concentration: a second disk failure within the same RAID 5 group kills the whole thing regardless of number of disks you’ve got. So you need to know about that level grouping to feel comfortable with your configuration.
This is where rebuild time comes in, and it’s far more critical than most folks appreciate. If one drive dies, the remaining drives on the controller will attempt to recover any lost information by writing it back to a new drive. Unfortunately, while the recovery are happening, the array remains in a partially redundant state.
For example, a single 4 TB drive rebuilding at 120 MB/s will take nine or so hours. A single 16 TB drive rebuild will take around thirty-seven hours. (And yes, it has gotten much worse over the years as we’ve had larger and larger drives.) That’s a very long time for your array to be at risk.
It’s also why single parity RAID 5 isn’t used for large disks anymore, there’s just too great a chance of another disk failing while it rebuilding.
But here’s the thing about each and every hard drive: they have a spec for how many bit errors can occur. For SATA drives for consumers, that’s typically measured as one in 1e14 bits. For enterprise drives, it’s 1e15 or higher. When a drive dies in a RAID 5 array, the controller has to go through and read every other bit on every other surviving drive to reconstruct the missing one. It only takes hitting a single unrecoverable bad sector, and the rebuild will fail.
The calculator figures out that likelihood given your drive’s error rate and the number of bits it needs to read. And what does that show? On big arrays, using consumer-grade disks, the odds often favor the rebuild failing rather than succeeding.
This is what these four result cards sum up. Maximum tolerable failures. It is the chance that a particular test case will survive. Estimation of how many hours it’ll take to get resynced. And the kicker: how much chance that a read error will kill rebuild? That’s the number you care about, because it measures the risk once the fans spin up.
To make this more concrete, let’s take the case of an eight-drive RAID 5 with 16 TB consumer drives with a rating of 1e14. That means about 112 TB will need to be read during the rebuild. That is about 900 trillion bits. Run those numbers through the probability equation and we’re over the ninety-nine percent chance of failure. You are betting against yourself.
Using RAID 6 allows for one unrecoverable read error because the second parity block protects it. So what does this mean in practice? When making decisions, use RAID 1 if it’s a boot volume. It’s easy and fast. If it’s a database that demands higher IOPS, then RAID 10 has good survivability with quick rebuild times. If you’re dealing with modest drives used as shares for smaller amounts of data, then RAID 5 may still hold up.
But if your drives exceed six or eight terabytes, the rising error probability coupled with long rebuild times means dual parity is the wise way to go. And if all else fails, assign a hot spare so automatic rebuilds begins.
Don’t get too rosy-eyed about failure rates. Again, remember that RAID is a mitigation strategy, not a backup. Run the numbers to understand the actual risk before putting your eggs in an array you don’t want cracking.