RAID 6 Capacity Calculator
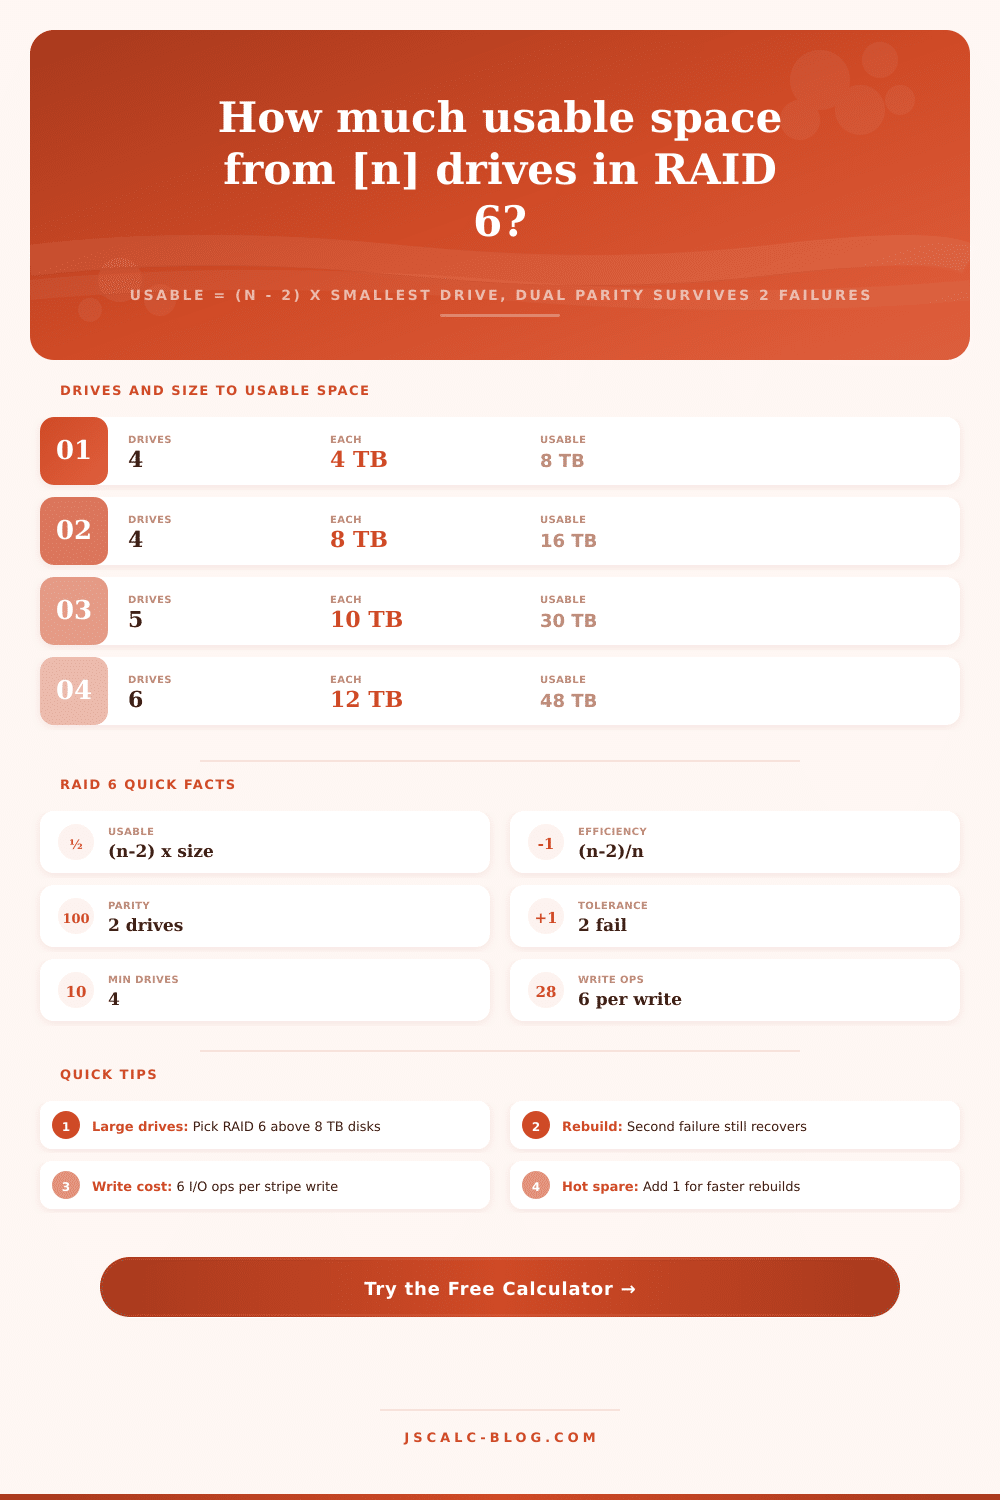
Estimate usable storage from a RAID 6 array using usable = (number of drives minus 2) times the smallest drive size. RAID 6 spends two drives on dual distributed parity (P and Q), so it survives two simultaneous disk failures, even a second failure during a rebuild. See usable space in decimal TB and binary TiB, capacity efficiency, read and write throughput with the heavy 6 input output write penalty, and fault tolerance.
🎯Real RAID 6 Array Presets
💾Array Configuration
RAID 6 needs at least 4 disks: two for data, two for dual parity.
Mixed sizes level down to the smallest drive in the set.
Applies to the per drive capacity above.
Sets a typical single drive throughput baseline you can override.
Sustained sequential speed of one disk; drives read/write estimates.
Chunk written per disk per stripe; larger suits big sequential files.
Standby disks held outside the array for automatic rebuilds.
Reserve for metadata and formatting; trims formatted usable space.
🔢RAID 6 Formula Snapshot
📋Usable Space by Drive Count
| Drives (n) | Per Drive | Usable = (n-2) x size | Parity Space | Efficiency |
|---|---|---|---|---|
| 4 | 8 TB | 16 TB | 16 TB | 50% |
| 5 | 10 TB | 30 TB | 20 TB | 60% |
| 6 | 12 TB | 48 TB | 24 TB | 67% |
| 7 | 12 TB | 60 TB | 24 TB | 71% |
| 8 | 16 TB | 96 TB | 32 TB | 75% |
| 10 | 12 TB | 96 TB | 24 TB | 80% |
| 12 | 16 TB | 160 TB | 32 TB | 83% |
| 16 | 16 TB | 224 TB | 32 TB | 88% |
📊Capacity Efficiency vs Array Width
| Drives (n) | Data Drives (n-2) | Parity Drives | Efficiency (n-2)/n | Raw Lost to Parity |
|---|---|---|---|---|
| 4 | 2 | 2 | 50.0% | 50.0% |
| 5 | 3 | 2 | 60.0% | 40.0% |
| 6 | 4 | 2 | 66.7% | 33.3% |
| 8 | 6 | 2 | 75.0% | 25.0% |
| 10 | 8 | 2 | 80.0% | 20.0% |
| 12 | 10 | 2 | 83.3% | 16.7% |
| 16 | 14 | 2 | 87.5% | 12.5% |
| 24 | 22 | 2 | 91.7% | 8.3% |
📏Decimal TB vs Binary TiB
| Marketed (decimal) | Bytes | Reported (binary) | Shrinkage |
|---|---|---|---|
| 1 TB | 1,000,000,000,000 | 0.909 TiB | 9.1% lower |
| 4 TB | 4,000,000,000,000 | 3.638 TiB | 9.1% lower |
| 8 TB | 8,000,000,000,000 | 7.276 TiB | 9.1% lower |
| 48 TB | 48,000,000,000,000 | 43.66 TiB | 9.1% lower |
| 96 TB | 96,000,000,000,000 | 87.31 TiB | 9.1% lower |
| 160 TB | 160,000,000,000,000 | 145.5 TiB | 9.1% lower |
🗃RAID Level Comparison Grid
| RAID Level | Capacity Efficiency | Min Drives | Fault Tolerance | Write Penalty | Rebuild Safety |
|---|---|---|---|---|---|
| RAID 0 | 100% | 2 | 0 drives | 1 (none) | None, any loss is fatal |
| RAID 1 | 50% | 2 | 1 per mirror | 2 | Fast copy from mirror |
| RAID 5 | (n-1)/n | 3 | 1 drive | 4 | Risky on large disks |
| RAID 6 | (n-2)/n | 4 | 2 drives | 6 | Survives 2nd fail in rebuild |
| RAID 10 | 50% | 4 | 1 per mirror pair | 2 | Fast, mirror rebuild |
⚙Formula Breakdown
💡RAID 6 Planning Tips
If rebuild time is too long for single parity RAID arrays and data loss is not an option, then you will want to look at RAID 6 as an option. This type of storage configuration add one more level of protection from having a drive fail during the rebuilding process. It’s very simple math underneath but it means big capacity hits on your servers. Calculate out the hit in capacity and see if it makes sense based off your workload. You give up capacity for security here.
How much can you actualy store? That’s simple math: take the number of drives minus two and multiply that by the capacity of smallest drive. You lose two drives to cover the extra work required by dual parity. For example, a six-disk array with 12 TB drives will net you 48 terabytes of storage, leaving 24 for protection. Every disk stores not only your data, but also its checksum; since parity is distributed across all disks, we’re still safe even if two drive fail.
Understanding RAID 6: Pros, Cons, and Capacity
Mathematically, this translates to losing two drives’ worth of capacity to safety. Arithmetically, this is where the calculator helps you avoid mental math errors. Plug your own hardware configuration numbers into a calculator to avoid wasting money. Beyond a certain point, dual parity offers important insurance. It’s the difference between an annoyance and losing your data entirely.
Rebuilding from scratch on a replacement drive after one drive has failed requires reading every other disk in the array. On today’s multi-terabyte drives, it take days. If the second drive fails while system is under that stress, chances are good it will be dead too. RAID 5 would of killed the whole array if a second drive failed.
RAID 6 finishes the rebuild and keeps the system running, which is why it’s the go-to solution for high-capacity drives (even at the expense of additional storage space). The efficiency of an array are proportional to how many drives it contains. While parity drives are a fixed cost, the wider the array the less overhead they represent. Parity is distributed across all disks rather than sitting on dedicated slaves.
So a four drive array is only half efficient. An eight drive array is seventy-five percent efficient. A twelve drive array is eighty-three percent. There’s a tradeoff here. Having more drives means less waste per disk, but it also increases the risk and rebuild time since you can tolerate fewer disk failures. Less drives = higher waste, but faster rebuild and lower risk. In other words: how much do you care about wasted disk vs. Is it an actual disk failure?
Different types of operations have different performance characteristics. For example, there is strong read speed because it has a full parallel stream from each non-parity disk. However, there is a heavy penalty on writes. Each small random write takes six input-output operations: the system needs to read old data and its parity then write the new data and update parity.
So this isn’t as good for write-intensive database-type workloads. But it’s fine for read-heavy ones, such as backups or media libraries. You can use the calculator to include drive throughput to get an idea of what your real speeds will be, not a theoretical maximum but something more realistic. It’s important to know that drive makers advertise in decimal (powers-of-ten) units, while operating systems report in binary (powers-of-two) units.
Manufacturers always report their capacity in terabytes, where each terabyte is equal to one trillion bytes. Your operating system reports it in tebibytes, these are powers-of-two units that is approximately nine percent bigger per-unit than terabytes. So if you buy a 48 terabyte array from a manufacturer, your operating system will report it as about 43.6 tebibytes in your file manager. There’s nothing broken, nor anything missing. It’s just a matter of different counting bases.
The calculator displays both values next to each other. The OS-reported capacity matches the capacity label above. This allows you to subtract filesystem overhead from that number for an accurate final estimate. So what about RAID 6?
RAID 6 comes at a price: Two drives’ worth of space lost (in capacity) plus some degradation in write speed. What do you get? It provides insurance against catastrophic hardware failure while maintaining zero data loss. That’s a bargain if you’re using big disk drives and performing bulk storage tasks. Just make sure that the trade-offs are worthwhile for your workload and number of drives used. Free space isn’t guaranteed, but the arithmetic doesn’t change.