RAID 5 Capacity Calculator
Size a RAID 5 array with single distributed parity. Enter your drive count and capacity to see usable space as (n minus 1) times the smallest drive, the one drive lost to parity, read and write throughput including the four-operation write penalty, and the one-drive fault tolerance with rebuild risk on large disks.
🗄Real RAID 5 Build Presets
💾Array Inputs
Total member disks in the RAID 5 set. Three is the minimum.
Raw size of each disk. Mixed sizes use the smallest.
Applies to the per-drive capacity field above.
Sets a typical single-drive throughput baseline.
Sequential speed of one disk. Auto-fills from drive type.
Chunk written per drive before moving to the next.
Idle standby disks that auto-rebuild on failure.
Higher load stretches rebuild time and degraded risk.
🔢RAID 5 At A Glance
📊Usable Capacity By Array Size
| Drives | Per Drive | Raw Total | Usable Space | Efficiency |
|---|---|---|---|---|
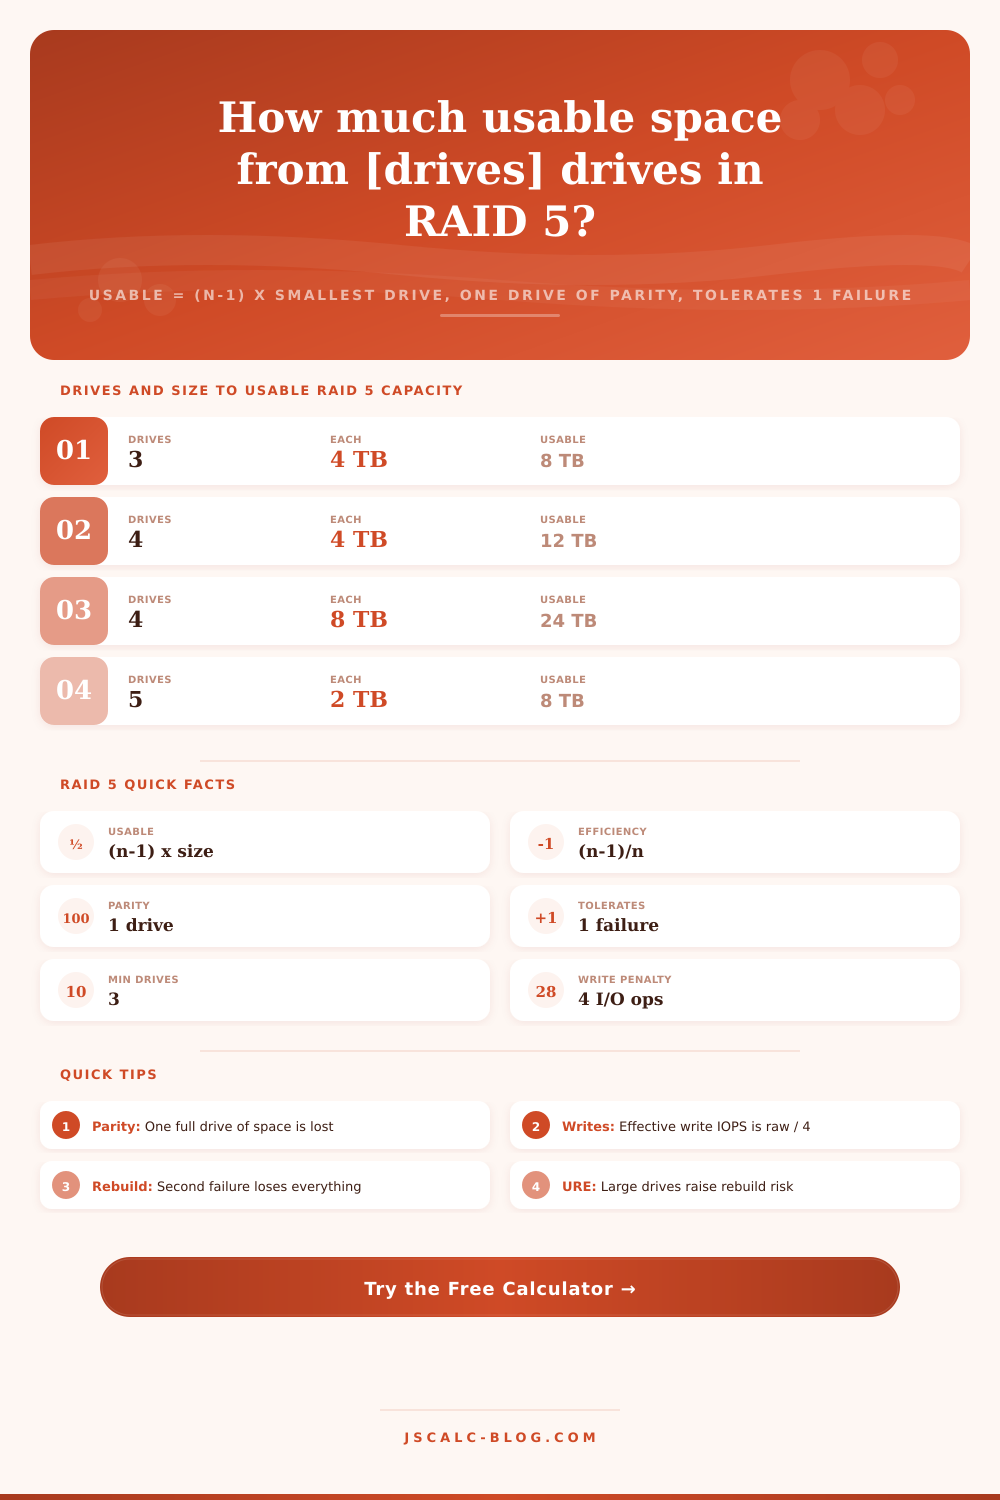
| 3 | 4 TB | 12 TB | 8 TB | 67 percent |
| 4 | 4 TB | 16 TB | 12 TB | 75 percent |
| 4 | 8 TB | 32 TB | 24 TB | 75 percent |
| 5 | 2 TB | 10 TB | 8 TB | 80 percent |
| 5 | 12 TB | 60 TB | 48 TB | 80 percent |
| 6 | 4 TB | 24 TB | 20 TB | 83 percent |
| 8 | 8 TB | 64 TB | 56 TB | 88 percent |
| 12 | 10 TB | 120 TB | 110 TB | 92 percent |
🗄RAID Level Comparison Grid
| RAID Level | Capacity Efficiency | Min Drives | Fault Tolerance | Write Penalty | Rebuild Risk |
|---|---|---|---|---|---|
| RAID 0 | 100 percent (n) | 2 | 0 drives | 1 op (none) | No parity |
| RAID 1 | 50 percent | 2 | 1 per mirror | 2 ops | Low, simple copy |
| RAID 5 | (n-1)/n | 3 | 1 drive | 4 ops | High on big disks |
| RAID 6 | (n-2)/n | 4 | 2 drives | 6 ops | Lower, dual parity |
| RAID 10 | 50 percent | 4 | 1 per mirror set | 2 ops | Low, mirror copy |
📈Throughput And Write Penalty
| Drives | Single Drive | Read (n-1) | Raw Write IOPS | Effective Write (raw / 4) |
|---|---|---|---|---|
| 3 | 175 MB/s | 350 MB/s | 4000 | 1000 |
| 4 | 175 MB/s | 525 MB/s | 4000 | 1000 |
| 4 | 530 MB/s | 1590 MB/s | 80000 | 20000 |
| 5 | 530 MB/s | 2120 MB/s | 80000 | 20000 |
| 6 | 3200 MB/s | 16000 MB/s | 500000 | 125000 |
| 8 | 175 MB/s | 1225 MB/s | 4000 | 1000 |
📏Decimal TB Versus Binary TiB
| Usable Decimal | Usable Binary | Difference | Note |
|---|---|---|---|
| 8 TB | 7.28 TiB | -9.1 percent | 3x 4 TB set |
| 12 TB | 10.91 TiB | -9.1 percent | 4x 4 TB set |
| 24 TB | 21.83 TiB | -9.1 percent | 4x 8 TB set |
| 48 TB | 43.66 TiB | -9.1 percent | 5x 12 TB set |
| 56 TB | 50.93 TiB | -9.1 percent | 8x 8 TB set |
| 110 TB | 100.05 TiB | -9.1 percent | 12x 10 TB set |
⚙Formula Breakdown
💡RAID 5 Planning Tips
RAID 5 is neither all redundant nor all useable, but it’s the best compromise. A RAID 5 setup use multiple drives (three or more) and stripes its data across them while also calculating a single additional block of parity for each stripe. Unlike a mirrored setup where data is duplicated on separate drive, this spreads parity blocks evenly over all the disks in the array. This way you don’t lose half your available storage to mirroring.
How much? The calculator above will tell you: usable capacity, the space lost to parity, throughput with the write penalty, and how the array behave when a drive dies. Select a drive type, enter number and size, read the cards.
How RAID 5 Works
RAID 5 has one key rule: it consumes exactly as much space as one of your drives for parity. If you have n drives of the same size, the usable space is the size of the smallest disk multiplied by (n, 1). On three 4 TB disks, the usable portion is (3 minus 1) times 4, or 8 TB. On four 8 TB disks, it’s (4 minus 1) times 8, or 24 TB.
Note also that parity isn’t on a sacrificial disk by itself, it’s distributed. Each drive contain a share of parity as well as a share of data. This allows RAID 5 to read from all members in parallel. It can still recover any member drive from the other drives’ parity.
As you increase your disk count, exactly one drive’s worth of capacity is used for parity regardless of how many drives you have. As an example, with three drives, exactly one drive’s worth of capacity go into parity. With four, only one goes into parity; that’s 25% of them, which means that a four-disk array keep 75% of raw space. Six drives are 83%, eight are 87.5%, ten are 90%, and so forth. Twelve drives are well above 90%.
That is the basic attraction of RAID-5: it allows for protection from a single disk failure, and scales to high efficiency as you add drives. Larger arrays with a single parity block has an increased rebuild risk, but they do scale in efficiency. And very large ones often migrate to double parity anyway.
RAID 5 is great for reads because each data member streams its own data. This gives good reads performance, which, as a rule of thumb, scales more then (n minus 1) times the single-drive speed. A four-disk SATA SSD array will do sequential reads approaching 1,590 MB/s if each disk does 530 MB/s.
Writes are the catch. With RAID 5, every little write generates four I/O ops: Read the old data; read the old parity; write the new data; write the new parity. This is the infamous RAID 5 write penalty. Random writes has effective throughput that’s somewhere around one-fourth the raw figure. The calculator above figures it out for you, so no need to mess about with drive specs conversions and coefficients.
Raid 5 can handle one disk failing without issue. The controller reverts to using parity to rebuild the lost information on the fly, keeping it alive while we replace the broken disk. It then uses the new drive to restore contents of the dead disk. That rebuild window is where the danger lies. With one drive down the RAID loses all its parity margin and becomes a degraded array. If anything else happens (another drive fails) or if there’s an unrecoverable read error on any other drive, you lose the entire array.
How long does it take to rebuild? It varies depending on your load setting and what drives you have. Large drives will take longer, a big 12 TB drive could take a day to rebuild. Your estimated time depends on your load setting and throughput. RAID 5 isn’t safer because of bigger drives; it’s riskier.
Most consumer drives are rated to have something like one unrecoverable read error in 10 to the 14th bits read. In other words, on average you get an error about once every 12.5 TB of reads. When rebuilding a big RAID 5 array, you’re reading every sector from each surviving disk. The probability of encountering one of those errors during a rebuild grows closer to sure as total capacity increases. That is why a lot of admins limit their single-parity RAID 5 arrays to moderately sized drives and jump to double parity when individual disks exceed 8 to 12 TB.
Having a hot spare reduces the exposure time by immediately beginning the rebuild upon any drive failure.
Operating systems don’t necessarily report the same storage capacity as drives do. And RAID 5 does not change that. When manufacturers say one drive is “TB,” they mean trillions of bytes (decimal). Operating systems typically use binary, meaning a TB is actualy $2^{40}$ bytes (TiB). The difference is always 9.1 percent. A RAID 5 array reporting 24 TB (decimal) of usable space shows about 21.83 TiB within the OS. Because the tool presents these two values side-by-side, you can provision accordingly without confusion when the time comes to format it and see how much you have inside your file manager. It is a small detail, but it matters.
Throughput cards are based off actual per-drive throughput baselines (so they reflect your hardware). For example, a 7200 RPM HDD is modeled at roughly 175 MB/s. A 5400 RPM HDD is roughly 135 MB/s. A SATA SSD is roughly 530 MB/s. An NVMe SSD is roughly 3,200 MB/s. Once you choose a drive type, that will auto-fill the throughput for a single drive. Then, you can tweak it to exactly match your specific model.
Stripe size is provided in 64 KB up to 512 KB. Small stripe sizes are better suited for random small-file workloads; large stripe sizes are more beneficial for big sequential media files. The last two inputs are hot-spare count and a rebuild-load setting, these give the estimated rebuild time more substance.
Begin from a similar configuration to what you’re building (e.g., eight drives for a rack array; three drives for a home NAS). Tweak the types, sizes and count of drives to match your components. You’ll see at-a-glance usable space in binary and decimal, one drive’s worth of capacity lost to parity, the throughput for reading and the penalized write, and how much is protected against a single drive failure with your hot-spare status. Every replacement figure is listed on the breakdown panel.
RAID 5 provides high capacity efficiency while protecting against a single disk failure. It asks you to pay attention to the rebuild window and write penalty in exchange. First size the array with straight numbers so the trade-off isn’t a surprise but a conscious decision. You should of seen that coming.