RAID 0 Capacity Calculator
Size a RAID 0 stripe set in seconds. Enter the number of member drives, per-drive capacity and drive type to get total usable storage in decimal TB and binary TiB, the aggregate read and write throughput as speed scales with every drive, and the blunt truth about RAID 0: zero fault tolerance, so any single drive failure destroys the entire array.
🎯Real Stripe Set Presets
🔧Array Inputs
RAID 0 needs at least 2 drives; more drives means more speed and more risk.
Nominal size printed on the drive; the smallest member limits all others.
Manufacturers label decimal TB; the OS often reports binary TiB.
Sets a realistic per-drive sequential throughput baseline.
Per-drive sequential speed; auto-filled by drive type, editable for Custom.
Chunk written per drive before moving to the next; larger favours big files.
Real striping rarely hits perfect n x; 85-95% is typical from bus overhead.
Usable share after filesystem metadata and reserve; NTFS/ext4 leave ~5%.
🔢RAID 0 At A Glance
📊Drives and Size to Striped Capacity
| Drives | Per Drive | Total Capacity | Approx Binary |
|---|---|---|---|
| 2 | 1 TB | 2 TB | 1.82 TiB |
| 2 | 2 TB | 4 TB | 3.64 TiB |
| 3 | 1 TB | 3 TB | 2.73 TiB |
| 3 | 2 TB | 6 TB | 5.46 TiB |
| 4 | 2 TB | 8 TB | 7.28 TiB |
| 4 | 4 TB | 16 TB | 14.55 TiB |
| 6 | 1 TB | 6 TB | 5.46 TiB |
| 8 | 2 TB | 16 TB | 14.55 TiB |
⚡Aggregate Throughput by Drive Type
| Drive Type | Single Drive | 2-Drive RAID 0 | 4-Drive RAID 0 | Bus Note |
|---|---|---|---|---|
| 5400 RPM HDD | ~100 MB/s | ~180 MB/s | ~360 MB/s | SATA fine |
| 7200 RPM HDD | ~160 MB/s | ~290 MB/s | ~576 MB/s | SATA fine |
| SATA SSD | ~550 MB/s | ~990 MB/s | ~1980 MB/s | SATA caps ~550 each |
| NVMe SSD (Gen3) | ~3500 MB/s | ~6300 MB/s | ~12600 MB/s | Needs PCIe lanes |
| NVMe SSD (Gen4) | ~7000 MB/s | ~12600 MB/s | ~25200 MB/s | Lane-limited fast |
| NVMe SSD (Gen5) | ~12000 MB/s | ~21600 MB/s | ~43200 MB/s | Controller bound |
🚩Array Reliability as Drives Increase
| Drives | Fault Tolerant | Single-Drive Fail Odds | Approx Array Fail Odds | Guidance |
|---|---|---|---|---|
| 2 | 0 | 2% per year | ~3.96% | Backup required |
| 3 | 0 | 2% per year | ~5.88% | Backup required |
| 4 | 0 | 2% per year | ~7.76% | Backup required |
| 6 | 0 | 2% per year | ~11.4% | High exposure |
| 8 | 0 | 2% per year | ~14.9% | High exposure |
| 12 | 0 | 2% per year | ~21.5% | Rarely advised |
🗃RAID Level Comparison Grid
| RAID Level | Capacity Efficiency | Min Drives | Fault Tolerance | Read Gain | Write Gain |
|---|---|---|---|---|---|
| RAID 0 (stripe) | 100% | 2 | 0 drives | Up to n x | Up to n x |
| RAID 1 (mirror) | 50% | 2 | 1 drive | Up to n x | 1 x |
| RAID 5 (single parity) | (n-1)/n | 3 | 1 drive | Up to (n-1) x | Reduced (parity) |
| RAID 6 (double parity) | (n-2)/n | 4 | 2 drives | Up to (n-2) x | Lower (2 parity) |
| RAID 10 (mirror+stripe) | 50% | 4 | 1 per mirror pair | Up to n x | Up to n/2 x |
⚙Formula Breakdown
💡RAID 0 Practical Tips
Redundancy isn’t built-in. RAID 0 doesn’t do any mirror copies or parity calculations. It’s a pure speed/capacity play. Gamers who has massive game collections, video editors working on 4K renders, they’re into it. Plug in four drives to get four times the space and approximately four times the speed.
But there’s no safety net. Data is split up evenly among all the drive, so if one drive fails everything is lost. There’s a calculator that can help explain the risk/reward calculation.
How to Plan Your RAID 0 Storage
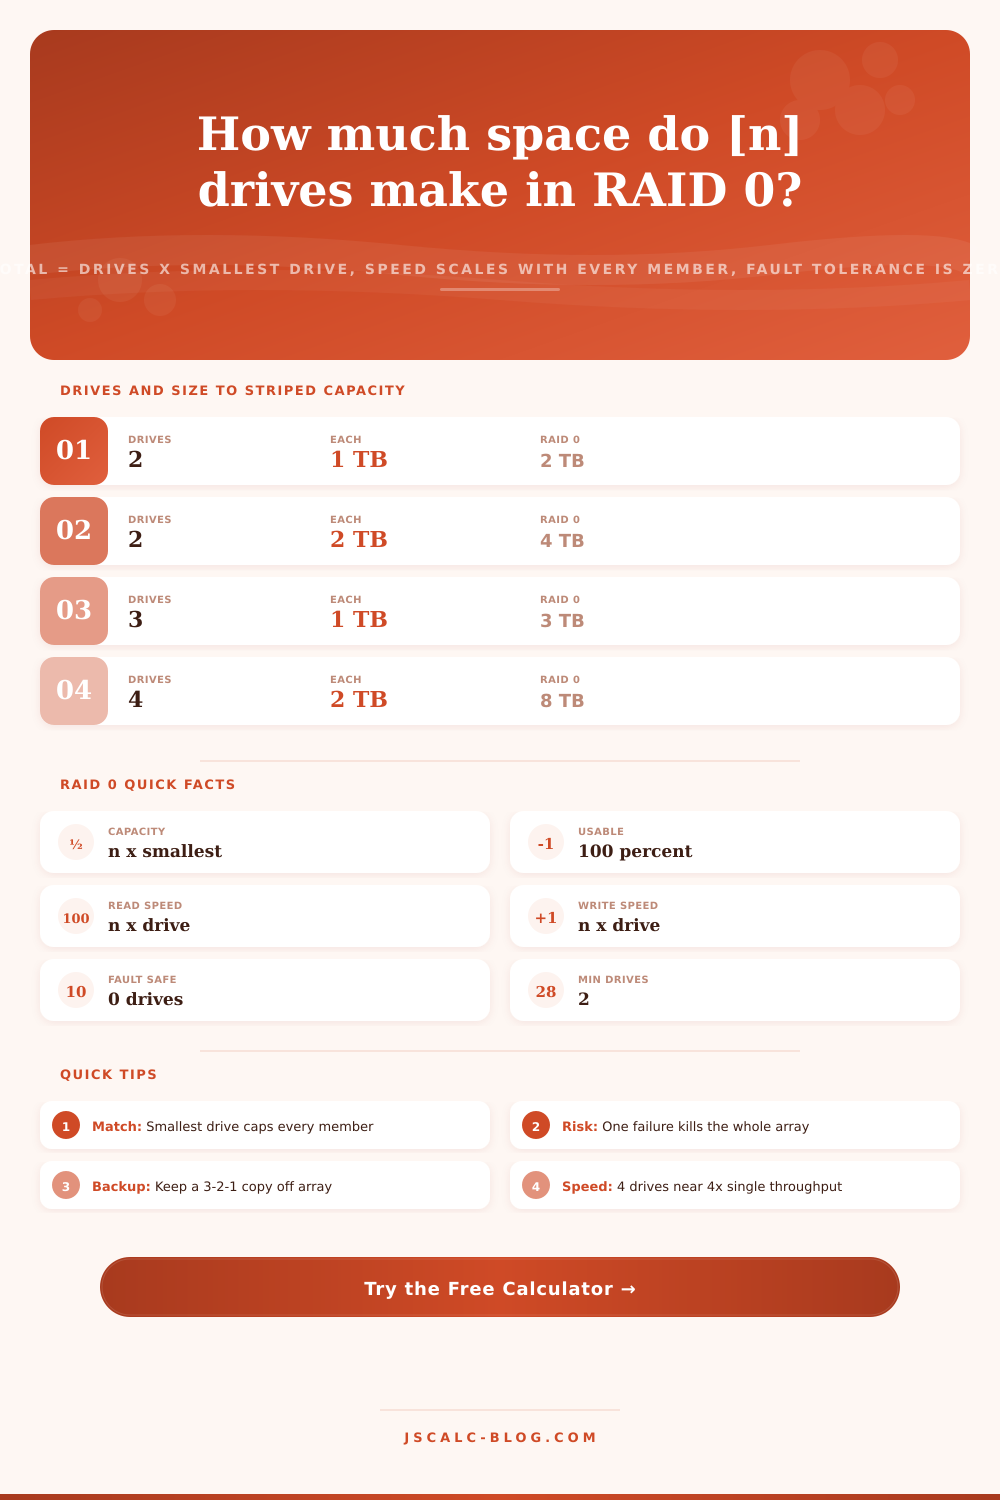
Calculating capacity is as easy as 2 + 2 = 4. The formula here is total capacity = (number of drives) x (size of smallest drive). Why does it matter? If you use two drives, one 500 GB and another 1 TB; they’ll max out at 1 TB, since that’s how much the smaller drive can hold. The bigger drive will be wasted, taking up half its capacity to keep pace with the other. That’s why the calculator figures this in for you; otherwise, you might think you’re getting more than just the biggest piece based off its raw specs.
At 100% usable efficiency, RAID 0 doesn’t reserve any bytes for protection. Each byte is fair game for inclusion in your storage pool, and that’s why people like it, even though it’s volatile.
Binary vs. Decimal Units: This one trips people up, too. Drives are sold in units of terabytes (powers of ten) by manufacturers but reported in tebibytes (powers of two) by operating systems. Your 8 TB array will show up as about 7.28 TiB on your desktop. It’s not that something is wrong… It’s just a difference in how computers are built and how drives is marketed. You’ll see both numbers displayed here so you’re never confused as to what you get when the drive spins up.
In RAID 0, speed increase steadily with the number of drives used. For example, one drive gives 1x speed, while two drives give 2x speed. Striped data vs. A parity array (which must calculate overhead during a write operation) improves both reads and writes. That’s why you see higher numbers on both sides. Controller overhead + bus limitations never let you reach those theoretical maxes in real world performance. The efficiency slider in the calc lets you scale down performance to match reality different than the marketing brochure.
And finally there’s the risk. It is the most important output. This has no room for error. One bad drive and you’re down. Every additional drive increases the odds of failure. At 2 percent per year for every single drive, a four-drive array has a nearly 8 percent chance it will fail completely each year. Faster? Yes. It is exponentially more exposed. Also yes.
Data are then chunked into stripes according to stripe size. For a sequential workload like video files, larger stripes are better as they allow each disk to stream efficienty. Random access pattern workloads like databases may find smaller stripes beneficial. You get the best performance here without changing any hardware.
Use RAID 0 for data that is already backed up elsewhere or is temporary anyway. Use it for game libraries to download again if necessary, scratch disks, or render caches. Anything that isn’t the only copy of something you can’t recieve back in another way. Build with a backup plan that accounts for this risk; the calculator will help you build an array sized both for space and for speed. Don’t build it until you have another copy somewhere. In RAID 0, there should of been no rebuild, just restore.