PSU Efficiency Rating Calculator
Enter the DC watts your system pulls, pick an 80 Plus tier and load level, and this tool returns the conversion efficiency, the AC power drawn at the wall, the waste heat dumped into your case, and the energy used across a year in kilowatt-hours. It is built around the energy-loss side of a power supply, not just a wattage total.
🎯Real PSU Presets
🔌Power Supply Inputs
The real DC watts your components draw, not the PSU label rating.
Certification badge printed on the power supply.
80 Plus tests efficiency at these three points.
Set above 0 to use a measured efficiency instead of the tier table.
Average daily runtime used for the annual kWh figure.
Days per year the system is powered for this workload.
🔢Formula Snapshot
📊80 Plus Efficiency Comparison Grid
| 80 Plus Tier | Eff at 10% | Eff at 20% | Eff at 50% | Eff at 100% | Peak Point |
|---|---|---|---|---|---|
| White (Standard) | - | 80% | 80% | 80% | Flat 80% |
| Bronze | - | 82% | 85% | 82% | 50% load |
| Silver | - | 85% | 88% | 85% | 50% load |
| Gold | - | 87% | 90% | 87% | 50% load |
| Platinum | - | 90% | 92% | 89% | 50% load |
| Titanium | 90% | 92% | 94% | 90% | 50% load |
🔋Wall Draw and Waste Heat at 300 W DC
| Tier at 50% Load | Efficiency | AC Wall Draw | Waste Heat |
|---|---|---|---|
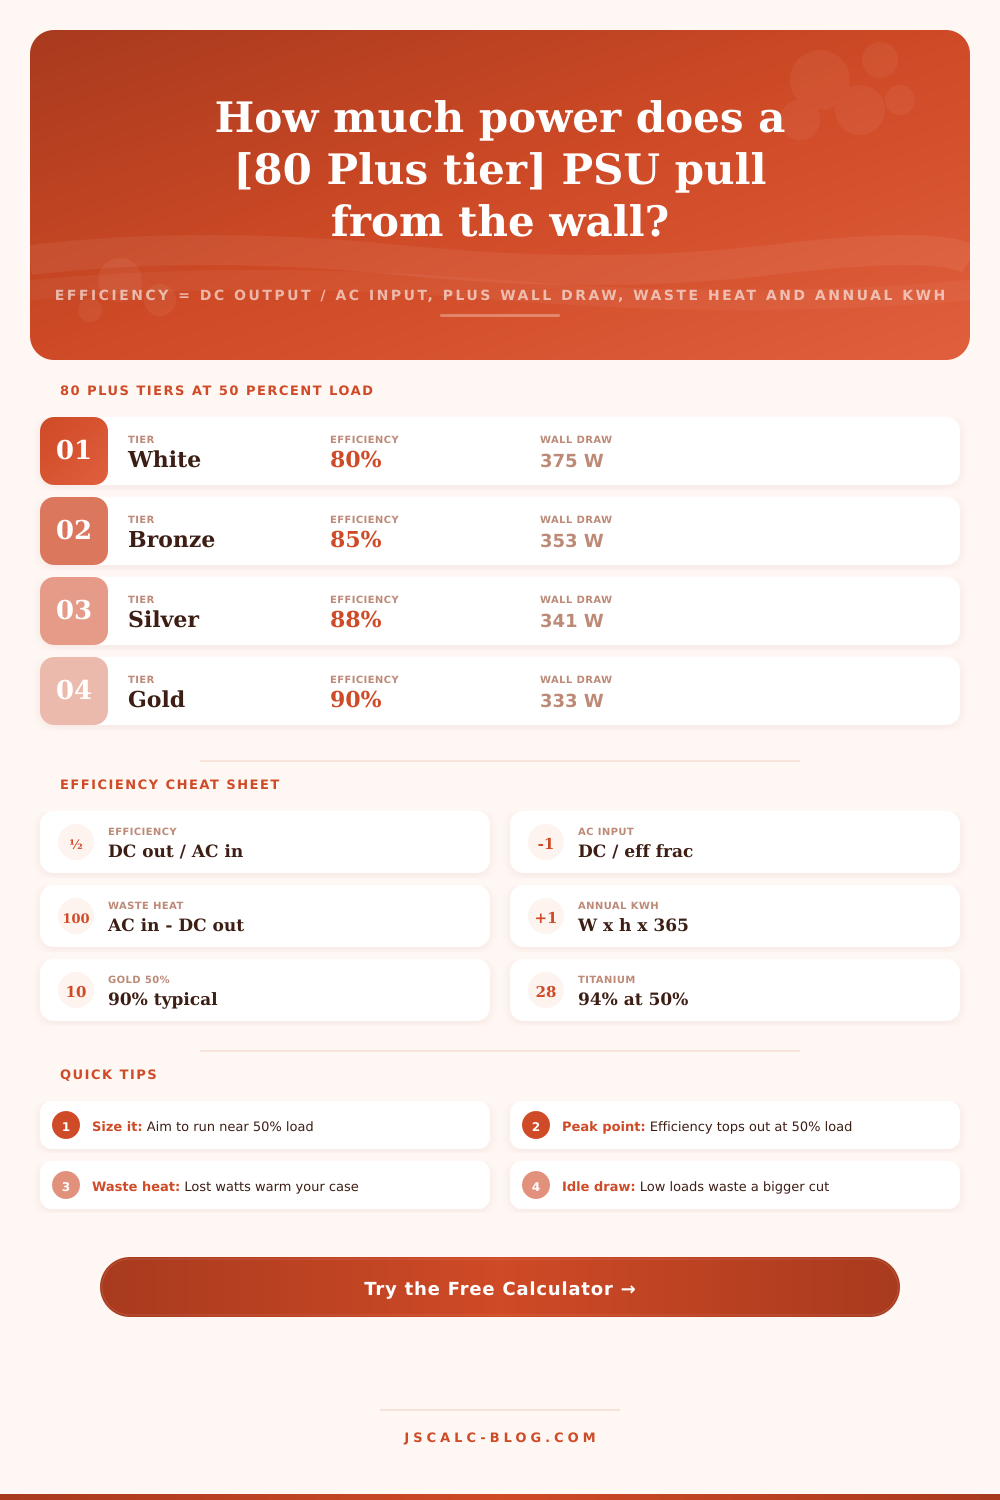
| White | 80% | 375 W | 75 W |
| Bronze | 85% | 353 W | 53 W |
| Silver | 88% | 341 W | 41 W |
| Gold | 90% | 333 W | 33 W |
| Platinum | 92% | 326 W | 26 W |
| Titanium | 94% | 319 W | 19 W |
📈Annual kWh by Daily Runtime (300 W DC, Gold)
| Hours per Day | AC Wall Draw | Daily kWh | Annual kWh |
|---|---|---|---|
| 2 hours | 333 W | 0.67 kWh | 243 kWh |
| 4 hours | 333 W | 1.33 kWh | 487 kWh |
| 8 hours | 333 W | 2.67 kWh | 973 kWh |
| 12 hours | 333 W | 4.00 kWh | 1460 kWh |
| 16 hours | 333 W | 5.33 kWh | 1947 kWh |
| 24 hours | 333 W | 8.00 kWh | 2920 kWh |
⚙Formula Breakdown
💡Efficiency and Sizing Tips
Your power supply doesn’t convert 100% of the watts pulled from the wall. During the process, some of the AC electricity turn into heat. How efficiently this happens depend on the power supply. You still have to pay for wasted energy though!
Plugging in your load will let the calculator do the rest. It will show you energy loss that the label wattages fail to include while saving you from having to guess at coefficients.
Understanding Power Supply Efficiency
The Greek letter eta is used to write efficiency. Efficiency = (DC output power / AC input power) X 100%. So if a unit take in 333 watts off the wall and then hands over 300 watts of DC to your graphics card, CPU and motherboard, it has an efficiency of roughly 90 percent.
That doesn’t mean that those 33 watts magically dissapears. They converted into heat within enclosure. The greater the efficiency reading, the more of the wall wattage make it to your parts and the less gets wasted.
That isn’t the same thing as capacity printed on the unit’s label. Capacity only shows how much max DC the unit can deliver. It does not indicate how clean it convert. That’s where folks goes wrong.
Power supply efficiency is measured in three load points (20 percent, 50 percent and 100 percent of a power supply’s rated wattage). They’re certified via the 80 Plus program. That program has a series of tiers starting with White and climbing to Titanium. At every load point, the efficiencies increases.
White is around 80 percent on all three. Bronze is around 82/85/82 percent. Gold is around 87/90/87. Platinum is around 90/92/89. Titanium is on top at around 92/94/90 percent. That grid is what the tool stores. It knows which efficiencies correspond to which tiers and then which load levels. So it looks up the right one based off whatever tier and load level you choose. This means the number that drives your result is the one they actualy tested it under.
Looking at the certification table, one thing jumps out. The most efficient point is around 50 percent load. Efficiency drops when the power draw is very light or very heavy. This is why size is important.
A 650 watt supply paired with a 325-ish watt system runs just over 50 percent load which is the sweet spot. Run the exact same 325 watt system on a 1200 watt unit and it idles down to roughly 27 percent load. At that point light-load losses increase and you lose a few points of efficiency. You can see this clearly from the reference table on the page, it shows you the penalty by tier.
After that it’s simple. Rearrange the definition and follow the math: AC in = (DC out) / efficiency fraction. If we have 90 percent efficiency, then the 300 watts of DC require 300/0.90 or 333.3 watts from the outlet. Step down a notch to an 80 percent White and the same 300 watts of DC are now asking for 375 watts off the wall.
That’s the difference you buy into with a higher tier. You get the same amount of work done but pull less from the mains. Waste heat equals the difference between what you put in versus what you get out. So, AC minus DC. Alternatively, it is DC x (one over the efficiency fraction) minus one.
If you have 300 watts of DC at 90 percent efficiency, the waste is 33.3 watts. At 80 percent, it jump to 75 watts. That’s what you lose. Heat. And those wasted watts increase the ambient air temp inside your chassis. Make your case and PSU fans turn faster. This increases heat load your cooling system must deal with.
In this example, where your load is 300 watts, you save yourself around 56 watts going from White to Titanium. That’s a significant decrease in both fan noise and chassis temperatures.
Energy accumulates. Watts describes a single moment. The relation between wall draw and the yearly figure is simple enough that the calculator does all the work converting it for us. To get annual energy in kilowatt-hours, just do AC watts x hours per day x active days / 1000. If we’re talking about a device that draws 333 watts and runs eight hours a day every day of the year, that’s around 973 kilowatt-hours over the course of the year.
It doesn’t report the number in money at all; only in kilowatt-hours. That makes it useful regardless of what you pay per unit, or where you live. Want to know the cost? Just multiply by whatever your local rate is. But on its own, the energy number are the honest answer.
And it has ten presets for realistic builds. These include everything from a 24/7 Titanium 1200 watt rig all the way down to a Bronze 500 watt supply maxed out, a Gold 650 watt unit running at half power, and a Titanium server whirring away at 80 percent continuously. Every build is represented in the form, which instantly recalculates and lets you know what’s going to happen with that build.
The four resulting cards show: waste heat lost, AC input drawn at the wall, conversion efficiency and annual energy used. Below that, a formula breakdown panel lists each number replaced, letting the tool function as a check on whatever you plug into it.
To read those numbers, though, you must realize that “efficiency” isn’t only about electricity bill savings, but it’s also about system stability and thermal management. Lower internal temperatures mean less waste heat. That lets components run longer (or faster). A few reference tables come with the calculator so you can see those trade-offs visually.
And you don’t have to plug all the variables in yourself either. The tool will help whether you’re choosing a new PC, sizing up an already-built one, or wondering what percentage of your electricity turn into case heat. In short, it puts conversion efficiency in concrete terms within a couple of seconds. Ultimately, it makes unseen energy waste visible, making the invisible tangible and usable again.