Population Variance Calculator
Calculate population variance as σ2 = sum((x - μ)2) / N, population standard deviation as σ = sqrt(σ2), and grouped frequency variance with weighted counts.
Load a complete population data pattern, then edit the values, frequencies, profile, unit label, and rounding.
Enter population data to calculate variance.
Raw mode treats every number as one population member. Frequency mode uses value and count pairs.
The profile changes interpretation text and coefficient of variation cues, not the math.
Use a known mean only when it is the true population center for these values.
Examples: scores, weights, ages, ratings, orders, seconds, or measurements.
Leave blank for unitless data; variance uses squared units while SD uses original units.
Displayed values round here; calculations keep full precision internally.
All rows are used; this only limits how many contribution rows are displayed.
Separate values with commas, spaces, semicolons, tabs, or line breaks.
| Value x | Frequency f | f x | x - μ | (x - μ)2 | f(x - μ)2 | Share of SS |
|---|---|---|---|---|---|---|
| Enter population values to see variance contributions. | ||||||
| Metric | Your value | Formula | Interpretation | Use in population variance |
|---|---|---|---|---|
| Grouped summary appears after calculation. | ||||
Population Variance
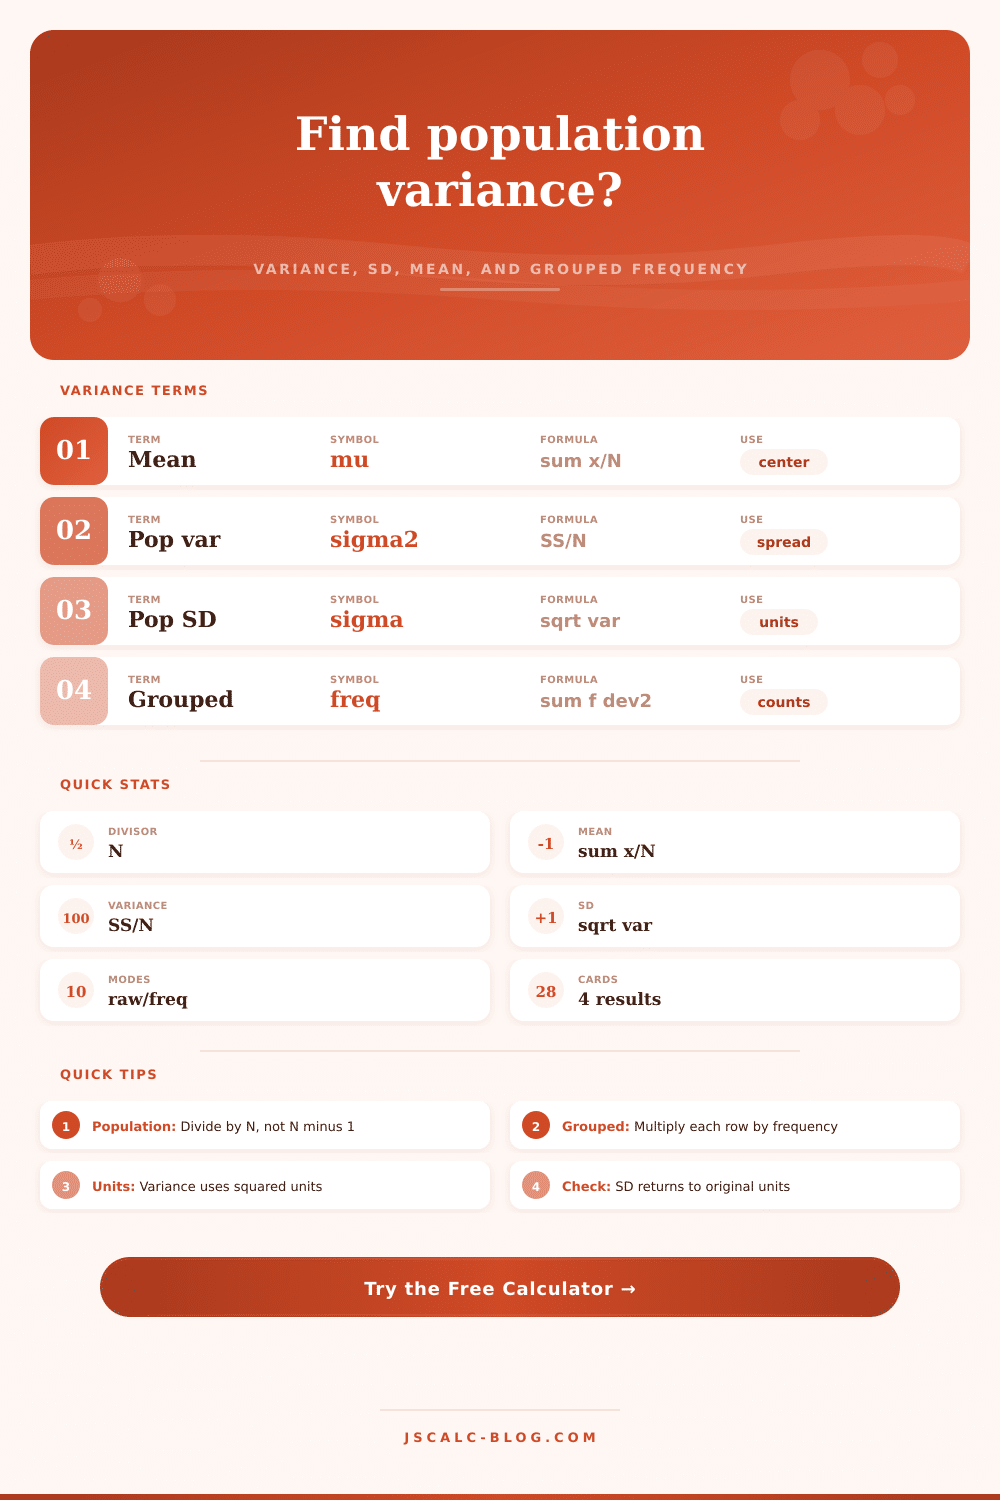
Use σ2 = SS / N when the values are the complete population you want to describe.
Sample Variance
Use s2 = SS / (n - 1) when the values are a sample estimating a larger population.
Grouped Frequency
Use σ2 = sum(f(x - μ)2) / N when repeated values are stored as counts.
Standard Deviation
Use σ = sqrt(σ2) when readers need spread in the original measurement units.
| Output | Formula | Divisor | Units | Best use |
|---|---|---|---|---|
| Population variance | σ2 = sum((x - μ)2) / N | N | squared unit | Complete population spread |
| Population SD | σ = sqrt(σ2) | none | original unit | Readable spread |
| Grouped variance | σ2 = sum(f(x - μ)2) / sum f | N = sum f | squared unit | Frequency table data |
| Population mean | μ = sum x / N or sum(fx) / sum f | N | original unit | Variance center |
| Coefficient of variation | CV = σ / |μ| | none | percent | Compare relative spread |
| Sample variance contrast | s2 = SS / (n - 1) | n - 1 | squared unit | Sample estimate only |
| Profile | Typical values | Spread cue | Good display precision | Watch for |
|---|---|---|---|---|
| Education scores | 0 to 100 points | SD often clearer than variance | 1 or 2 decimals | Curved scores vs raw scores |
| Quality control | weight, length, thickness | Small SD can matter | 3 to 6 decimals | Unit conversion and calibration |
| Survey ratings | 1 to 5 or 1 to 10 | Bounded scale spread | 2 decimals | Ordinal scale interpretation |
| Operations counts | orders, calls, defects | Compare CV with average load | 1 or 2 decimals | Seasonality and outliers |
| Lab measurements | pH, concentration, absorbance | Report SD with units | 3 or 4 decimals | Instrument resolution |
| Timing data | seconds or minutes | Right tails are common | 3 decimals | Long pauses or miscoded zeros |
| Demographic values | ages, household sizes | Frequency tables are efficient | 1 or 2 decimals | Grouped bins vs exact values |
| Financial amounts | revenue, balances, spend | High CV is common | 2 decimals | Large outliers dominate SS |
Many folks compute it. Not many love to look at it. Variance is one of those stats. You might think of it as a vague figure that has no meaning outside of making you feel bad about your grades during statistics class. But variance isnt anything other than an indicator of how inconsistent your data set is with itself.
When your customer base spend exactly the same dollar value per month, your variance will be zero. That means life is predictable … and boring, too. From the instant it starts going up, you’re talking about inconsistency. And inconsistency are where the story is for business, manufacturing and even education. So when you choose to view all data points or groups of similar data, the calculator does the work for you.
Why Variance Matters in Business
Data can be treated in two very different ways: as a raw list, or as a frequency table. If you have thousands of entries with the same value, it’s painful to type each one individually. If you group them based off their value and how many there are of that value, then its easy. The math is exactly the same; the only difference is the way you’re inputting data; you’re basically instructing the tool that this value occurs x number of times, instead of having to type it out. It is a slight difference, but it will save you hours of data entry mistake.
But the biggest error people make is mixing up sample variance and population variance. They sound alike, but they are not the same thing. They also address two different questions. With population variance, you divide by N (the total number of items from the dataset). And with sample variance, you divide by N minus one. The reason is this: Samples (by definition) understate the range of the overall population. So you inflate your result a bit to correct for this bias… And you do so by dividing by a smaller number.
Now, if you actualy have all the data (i.e., if you’ve got every single widget manufactured in a given batch, or every single student enrolled in a particular class), then you must divide by N. Applying the sample formula to full data will produce larger variance. That’s what most folks get wrong. Out of force of habit, they’ll grab the sample formula, even though they’re working with the whole enchilada. More than you think.
Units do matter. Variance is measured in squared units. If your data is dollars, then your variance is dollar-squared. You cannot spend that. It’s a mathematical result from taking the deviations, squaring them, and summing it all up. Why standard deviation? It takes the square root of the variance, returning the number to its original units. So now you can say: the typical deviation is five dollars, rather than twenty-five dollar-squared. The calculator gives you both. You will want the variance for additional statistical modeling, but people understands the standard deviation more easily.
When you run those numbers, look at the contribution table. That’s the part that breaks it down by each value (or group) and how much they contribute to the total spread. Often you’ll see that just a few extreme outliers are contributing the majority of it. One huge value way out on one end of the mean will inflate the whole thing further then dozens of moderate ones closer to the middle. That’s what happens with squared deviations. They punish distance exponentially.
If you are trying to lower variance in a manufacturing process, you should of do more to stabilize things by fixing the occasional extreme defect than by tightening up the average by a bit. It’s all about controlling the tails. But what does that mean? Well, it depends on context. Ten could represent an enormous difference in a test score measured on a 20-point scale… but nothing at all in a $10M in annual revenue. That is why we like the coefficient of variation. The coefficient expresses a spread as a percent of its mean. So you can look at two entirely different datasets and understand their relative variability. Is a chaotic, high-volume process really less reliable than a stable, lower-volume process? The coefficient lets you know which one is more reliable by removing the effect of scale.
In conclusion: Variance isn’t a stat for your report; it’s a way to diagnose what part of your process leaks consistency. That might be an issue with quality control weights, or an issue with survey response. But whatever you’re looking at, whether you are analyzing survey responses or quality control weights, you want to know about the shape of the data as well as the location of the middle. With that in mind, here’s the calculator, and let me know if I can help with the interpretation.
The numbers will only tell you part of the story; you still need to ask why they spread. What you learn from that can be worth more than how far they spread. It’s the difference between raw data and actionable insight.