PCB Trace Resistance Calculator
Find the DC resistance of a copper PCB trace from R = rho x L / (w x t), where length, width, and copper thickness set the geometry. Adjust for copper weight and operating temperature, then read the voltage drop and power dissipated at your working current so you can size rails and signal traces with real numbers.
🎯Real Trace Presets
📝Trace Inputs
Conductor run length along the copper trace.
Applies to the length field above.
Trace width in mils, where 1 mil = 0.001 inch.
Sets finished copper thickness at oz x 34.8 um.
Resistivity rho in ohm-metre at 20 C.
Copper resistance rises about 0.393% per degree C.
Steady DC current for voltage drop and power loss.
Controls rounding on every result card.
🔢Formula Snapshot
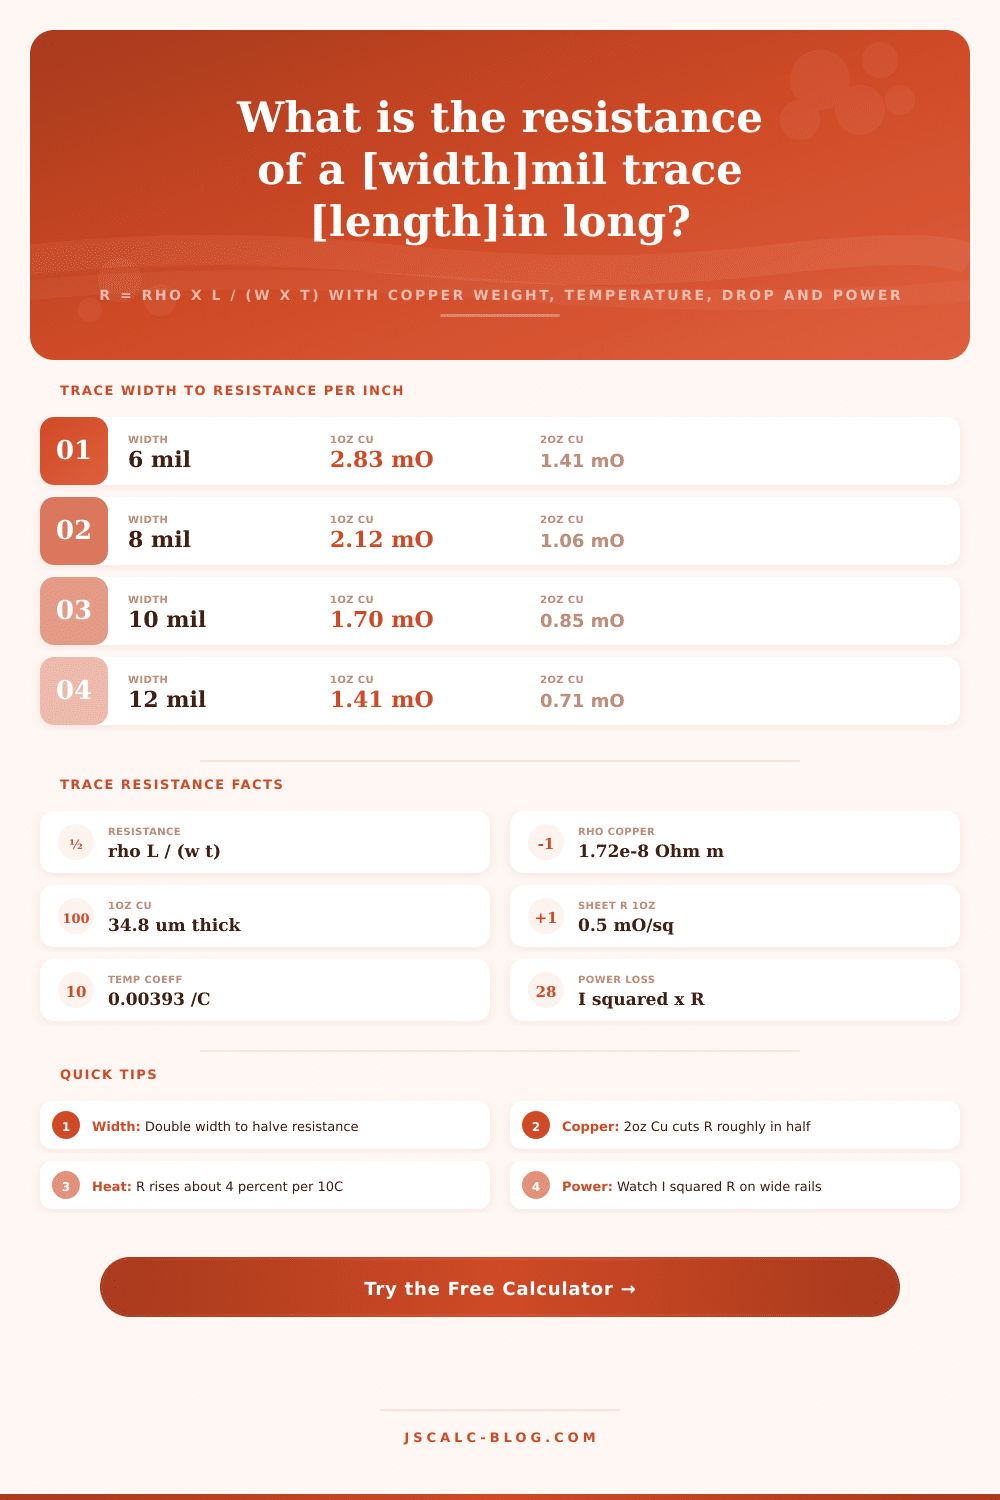
📋Trace Width to Resistance per Inch
| Trace Width | 1oz Cu (mOhm/in) | 2oz Cu (mOhm/in) | Squares per Inch |
|---|---|---|---|
| 6 mil | 2.83 | 1.41 | 166.7 |
| 8 mil | 2.12 | 1.06 | 125.0 |
| 10 mil | 1.70 | 0.85 | 100.0 |
| 12 mil | 1.41 | 0.71 | 83.3 |
| 15 mil | 1.13 | 0.57 | 66.7 |
| 20 mil | 0.85 | 0.42 | 50.0 |
| 25 mil | 0.68 | 0.34 | 40.0 |
| 50 mil | 0.34 | 0.17 | 20.0 |
| 100 mil | 0.17 | 0.08 | 10.0 |
🌡Temperature Effect on Resistance
| Temperature | Delta T from 20 C | Multiplier | 10 mOhm Becomes |
|---|---|---|---|
| 0 C | -20 C | 0.921 | 9.21 mOhm |
| 20 C | 0 C | 1.000 | 10.00 mOhm |
| 25 C | +5 C | 1.020 | 10.20 mOhm |
| 40 C | +20 C | 1.079 | 10.79 mOhm |
| 60 C | +40 C | 1.157 | 11.57 mOhm |
| 85 C | +65 C | 1.256 | 12.56 mOhm |
| 105 C | +85 C | 1.334 | 13.34 mOhm |
| 125 C | +105 C | 1.413 | 14.13 mOhm |
📏Copper Weight and Units Reference
| Quantity | Value | In Base Unit | Note |
|---|---|---|---|
| 0.5 oz copper | 17.4 um | 1.74e-5 m | Thin fine-pitch copper |
| 1 oz copper | 34.8 um | 3.48e-5 m | Most common outer layer |
| 2 oz copper | 69.6 um | 6.96e-5 m | Power and high current |
| 3 oz copper | 104.4 um | 1.044e-4 m | Heavy bus and rails |
| 1 mil width | 0.001 in | 2.54e-5 m | Width unit for traces |
| 1 inch length | 1000 mil | 0.0254 m | Length unit conversion |
🗃Width vs Resistance per Inch Comparison Grid
| Trace Width | 1oz mOhm/in | 2oz mOhm/in | 3oz mOhm/in | Drop at 1A (1oz) | Loss at 1A (1oz) |
|---|---|---|---|---|---|
| 6 mil | 2.833 | 1.417 | 0.944 | 2.833 mV/in | 2.833 mW/in |
| 8 mil | 2.125 | 1.063 | 0.708 | 2.125 mV/in | 2.125 mW/in |
| 10 mil | 1.700 | 0.850 | 0.567 | 1.700 mV/in | 1.700 mW/in |
| 15 mil | 1.133 | 0.567 | 0.378 | 1.133 mV/in | 1.133 mW/in |
| 20 mil | 0.850 | 0.425 | 0.283 | 0.850 mV/in | 0.850 mW/in |
| 25 mil | 0.680 | 0.340 | 0.227 | 0.680 mV/in | 0.680 mW/in |
| 50 mil | 0.340 | 0.170 | 0.113 | 0.340 mV/in | 0.340 mW/in |
| 100 mil | 0.170 | 0.085 | 0.057 | 0.170 mV/in | 0.170 mW/in |
| 150 mil | 0.113 | 0.057 | 0.038 | 0.113 mV/in | 0.113 mW/in |
| 200 mil | 0.085 | 0.043 | 0.028 | 0.085 mV/in | 0.085 mW/in |
⚙Formula Breakdown
💡Trace Resistance Design Tips
A printed circuit board is covered in copper traces, which behave like resistors, and yes, you can measure them. Sure, you may have designed a power rail that’s got no impedance whatsoever, but the electrons don’t believe your wishful thinking.
By the simple law of geometry: Resistance is equal to resistivity times length divided by cross sectional area. In other words, that area (width times thickness) are simply the area inside the trace.
Why PCB Traces Act Like Resistors
This calculator converts that physical description into some hard numbers (in milliohms). It takes into account operating temperature and copper weight. It shows you how much power is dissipated at your working current and matching voltage drop. Its purpose? To let you determine if a trace is too thin and thus dangerous, or generous enough before you go ahead and fab the board.
How much is something resistant? Resistance are the measurement of how hard something resists current flow. With a rectangular trace made from metal like copper, there is no variable except for shape and type of material. The resistivity of copper (resistance per unit of length) is fixed at 1.72e-8 ohm-metre @ 20 degrees C. That’s a constant.
Now the length: as length increases, resistance increase proportionally; twice the length is twice the resistance. Cross sectional area decreases resistance; since more space exist for the electrons to move, there is less resistance. Because these traces are very narrow, their resistance is typically only several milliohms, that sounds inconsequential, but when high amounts of current are pushed through, those little numbers translate to actual heat and detectable voltage drop.
This is where folks most frequently go off the rails. They look at small numbers and think “oh, that can’t be important!” But it is. Every single milliohm counts in power distribution.
The result is dominated by two inputs, the geometry. The trace width is quoted in mils: 1 mil = 0.001 inch. To convert to metres multiply by 2.54e-5.
The copper thickness is specified using the copper weight in ounces. An ounce of copper spread out over a square foot are around 34.8 micrometres thick. The standard 1 oz outer layer is 34.8 um and the 2 oz power layer is 69.6 um. Moving from 1 oz to 2 oz copper roughly halves the resistance for the same width because it changes thickness which appears in denominator. Increasing the width achieves the exact same effect but doesn’t change what copper you need to order. On power rails you should reach for an extra bit of width first because it’s often cheaper than making it thicker.
Engineers often sanity-check these results using sheet resistance, measured in ohms per square. Sheet resistance varies depending on materials; approximately 0.5 milliohm per square for one-ounce copper. Simply divide the trace’s length in same units as its width to find out how many squares it has. Then multiply that by the sheet resistance and voila! This gives the same result as the whole formula. This calculator displays them both side by side, so you can check your math independently. When the design is being checked, this is a reassuring double-check.
This underestimates the loss and drop on a warm rail but it also ignores the fact that copper becomes more resistant as it warms up. Based off a temperature coefficient of 0.00393 per degree Celsius, the relationship between temperature and resistance is linear. For example, there is about a 4 percent increase in resistance for each 10 degrees C over room temperature. A trace with a 10 milliohm resistance at 20 C will be approximately 12.56 milliohms at 85 C, a significant 25 percent increase. The tool takes this into account automatically, showing you the true resistance of your operating trace instead of its ideal lab value.
Voltage drop equals current times resistance, using the adjusted temperature. Current squared times resistance equal power dissipated (i.e., how much does this trace heat up?). Squared is the key point: double the current and it heats up four times. In general with logic supplies, you don’t want more than 100 millivolts of total drop. Long traces carrying large current can experience serious I squared R heating; that heat increases the resistance in a feedback loop.
So let’s take a 2 inch long, 1 ounce copper trace that’s 10 mils wide. When carrying 1 ampere, it loses about 99 millivolts (100 mV) at room temp and dissipates 99 milliwatts of heat. If you warm this trace up to 85 degrees Celsius, its resistance will increase by 25 percent.
Each run produces summary results cards showing the voltage drop, power loss, and base resistance adjusted for temperature. Real-world presets cover fine-pitch signals through heavy bus bars, what engineers see every day on boards. You can begin with one of these presets, then tweak width, copper weight, or current as needed for your board.
You don’t realize how much trace resistance matters until your traces are hot, or some rail has sagged, but that’s after the board’s been built. This calculator strictly measures DC Ohmic resistance. It does not consider thermal sizing as defined in IPC standards (that’s another story). But it provides you with a reliable estimate quickly so you can plan for drop, or check the performance of your bus bars before making them.
The result? Invisible physics becomes design data you can use. It also provides a clear picture of what that copper realy costs in terms of heat and voltage.