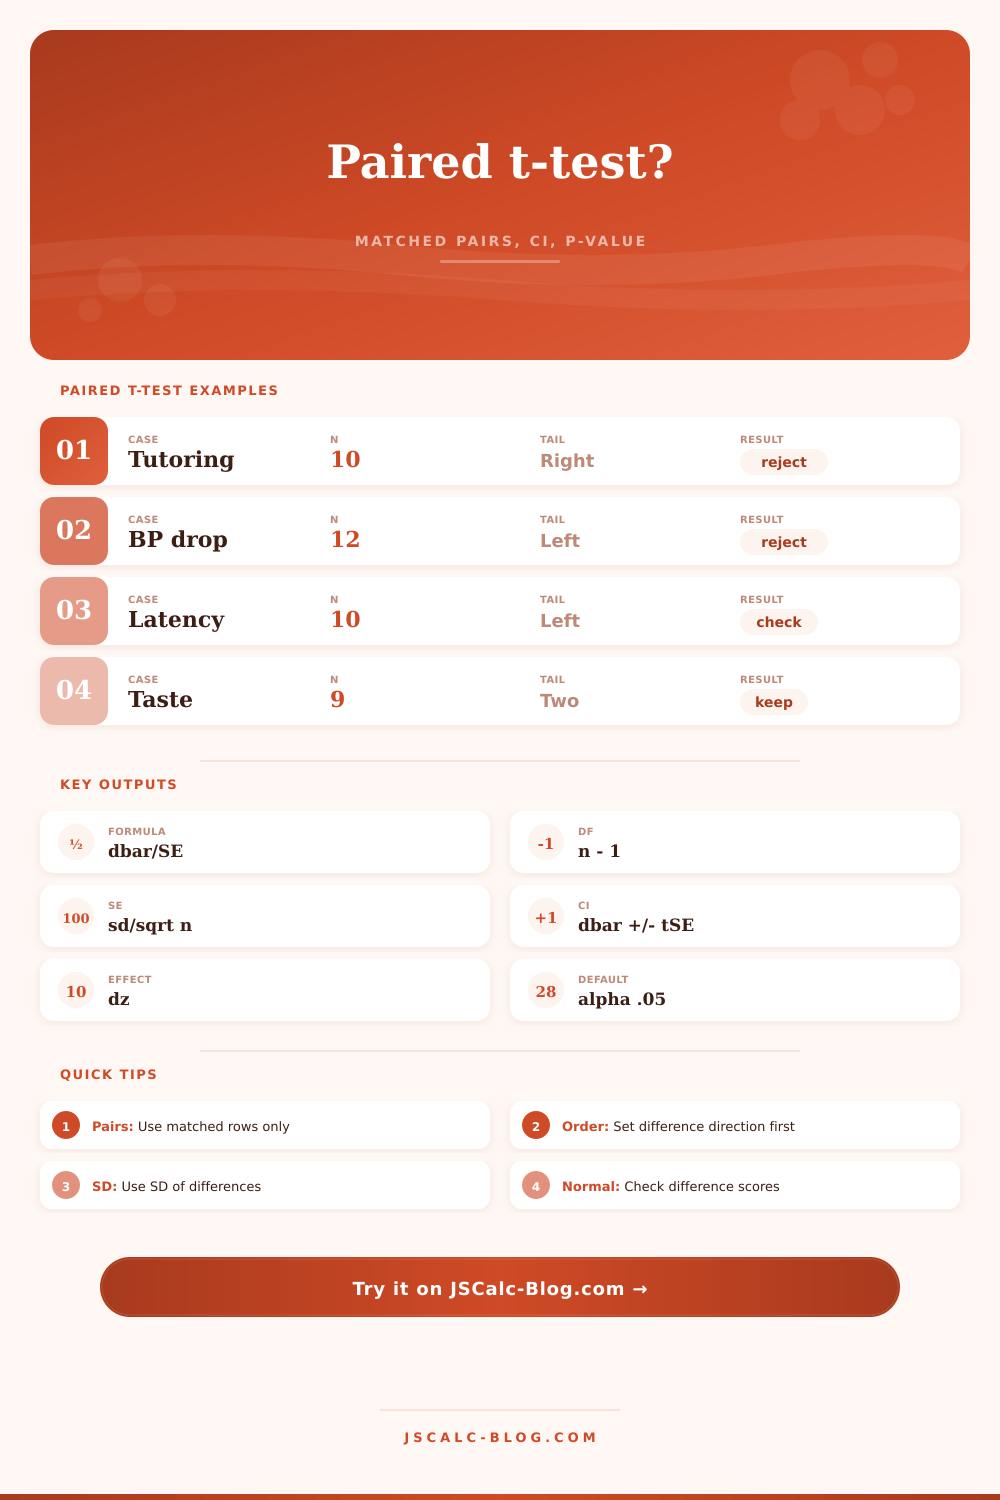
Paired T-Test Calculator
Compare matched measurements from the same people, items, or locations with JSCalc-Blog.com. Enter raw pairs or summary difference statistics to calculate the paired t statistic, df, p-value, confidence interval, and dz effect size.
Load a real matched-pair example, then edit the values for your study.
| Pair | Before | After | Difference |
|---|---|---|---|
| 1 | 72 | 78 | 6 |
| Quantity | Formula | Use | Notes |
|---|---|---|---|
| Difference score | d = after - before | Converts each pair into one value | Reverse direction if lower is better |
| Mean difference | dbar = sum d / n | Average paired change | Compared with the null difference |
| Standard error | SE = sd / sqrt(n) | Uncertainty of dbar | Uses SD of differences, not raw SDs |
| Paired t | t = (dbar - mu0) / SE | Test statistic | df = n - 1 |
| Confidence interval | dbar +/- t*SE | Likely range for mean change | Two-sided t critical value |
| Effect size | dz = (dbar - mu0) / sd | Standardized paired change | Uses within-pair difference SD |
| Situation | Tail | Null value | Interpretation focus |
|---|---|---|---|
| Any average change | Two-tailed | 0 | Difference in either direction |
| Improvement expected | Right-tailed | 0 | Mean difference greater than null |
| Reduction expected | Left-tailed | 0 | Mean difference less than null |
| Nonzero benchmark | Any selected tail | Set by user | Change beyond a practical target |
| Small sample | Usually two | 0 | Check difference-score normality |
| Matched control pairs | Study-specific | 0 | Within-pair contrast, not group SD |
So, now you have the after scores. And there are the before scores. But what do they mean? Are those two sets of number real or is it just some random fluke? This is where the paired t-test comes into play. If you’re working with biological samples or human subjects (or anything that changes over time), then it’s likely one of most practical tools in the box.
The calculator above does all the heavy lifting for you while you focus on the story your numbers are trying to tell you. It’ll take the matched pair and reduce it down to this: how different is the mean? It’s simple, and that makes the elegance of the logic all the more elegant: rather than compare two group, you compare each group to itself. Each subject are measured before and after an intervention (a new software patch, a tutoring program, or a dietary supplement).
How to Use the Paired T-Test Calculator
You must decide whether to use after-minus-before or before-minus-after score. And then you ask if that mean difference (averaged across subjects), is meaningfully different from zero, or whatever your chosen null hypothesis happen to be. That’s important because it accounts for differences between people. Some may begin low and remain low; others may begin high and remains high. Comparing their before-and-after removes the background noise of who they are. It leaves behind just the signal of the intervention.
The first decision point sets up the direction of the difference. Do you want to test before minus after? Or do you want after minus before? This may sound trivial, but it determines whether your t-statistic has a positive or negative sign. Choose before minus after if you think you have improved things, meaning your “treatment” increases whatever you are measuring. On the other hand, perhaps you are measuring latency (longer isnt good) or pain scores (lower is better). In those cases, you might want the opposite order and then see a positive t-value as a good outcome. You can see in the reference table on the page how the sign corresponds to your alternative hypothesis. Get this one correct and the final read-out will make sense instead of being confusing.
And then there are your tails. By default, most researchers use a two-tailed test; in other words, they want their test to pick up any deviation from the null (positive or negative). If you have good theoretical reasons to expect an effect to be in only one direction, you’d get more power for detecting that with a one-tailed test. You can flip between them here quick on the tool. Just keep in mind that going with a one-tailed test when you don’t justify doing so is a sure-fire way to have someone who knows stats slam your paper. Two-tailed unless you’re sure is the way to go.
You get back from this an effect size, a confidence interval, and a p-value. The p-value indicates whether or not result is statistically significant. But the confidence interval describes how large the effect could potentially be. And then the effect size (in this case Cohen’s d sub z) begins here. This standardizes the mean difference divided by the standard deviation of the differences. What does that mean? That means it answers the question of magnitude. If there’s a tiny p-value and a negligible effect size, what we’ve got is often an overly large sample that isnt a meaningful discovery at all.
The other error I see people make is conflating the standard deviation of the differences with the two sets of raw standard deviations. The former is what the math need. It’s not enough to grab the SD of one group (the “before” set) and then grab the SD of another (the “after” set) and then take an average. That assumes there is no correlation between the pairs, which is precisely why they’re paired in the first place. If you paste in raw pairs, the calculator will automate that part for you (it’ll know what denominator to use). But if you input summary stats, you have to supply it the SD of the differences. Check that over twice.
But there’s an “if” here: assumptions. Specifically, the paired t-test assume that the differences are normally distributed. It is not the raw scores. These are the changes. As your sample size grows, the central limit theorem helps make the relaxed assumption work. A tiny number of outliers in the change scores can mess things up with smaller sample sizes. Consider switching to a non-parametric analysis (like the Wilcoxon signed-rank test) if your difference scores seems heavily skewed. The software will still do the t-test, but it’s on you to interpret it properly.
So, what’s the bottom line? The paired t-test is a tool for viewing the world through the lens of consistency of change despite variability between people. Apply it to your intervention testing and then look at not just if there was significance but also how big that significance was. Something can be statistically significant yet still have no practical importance. The calculator will give you the numbers. You’ll add the context. That’s where the gold nuggets are found.