Packet Loss Impact Calculator
Enter your packet loss and path details to see how much it hurts. This tool finds the loss percentage, applies the Mathis equation to cap TCP throughput at MSS / RTT times 1 over the square root of the loss probability, computes goodput after retransmissions, and rates the connection for file transfer, VoIP, video, or gaming.
🌐Real Network Scenarios
🔧Path and Traffic Inputs
Choose counts to derive loss, or type a known loss rate.
Total packets transmitted over the measurement window.
Packets dropped or never acknowledged (count mode).
Used when the input method is set to direct percentage.
TCP segment size; 1460 is typical on 1500-byte MTU.
Ping between the two hosts in milliseconds.
Raw bandwidth of the slowest link on the path.
Sets the quality thresholds used for the rating card.
🔢Formula Snapshot
📊Loss Percent to Mathis TCP Throughput
| Loss % | Loss p (fraction) | 1 / sqrt(p) | TCP Cap at 40 ms RTT | Relative to 0.01% |
|---|---|---|---|---|
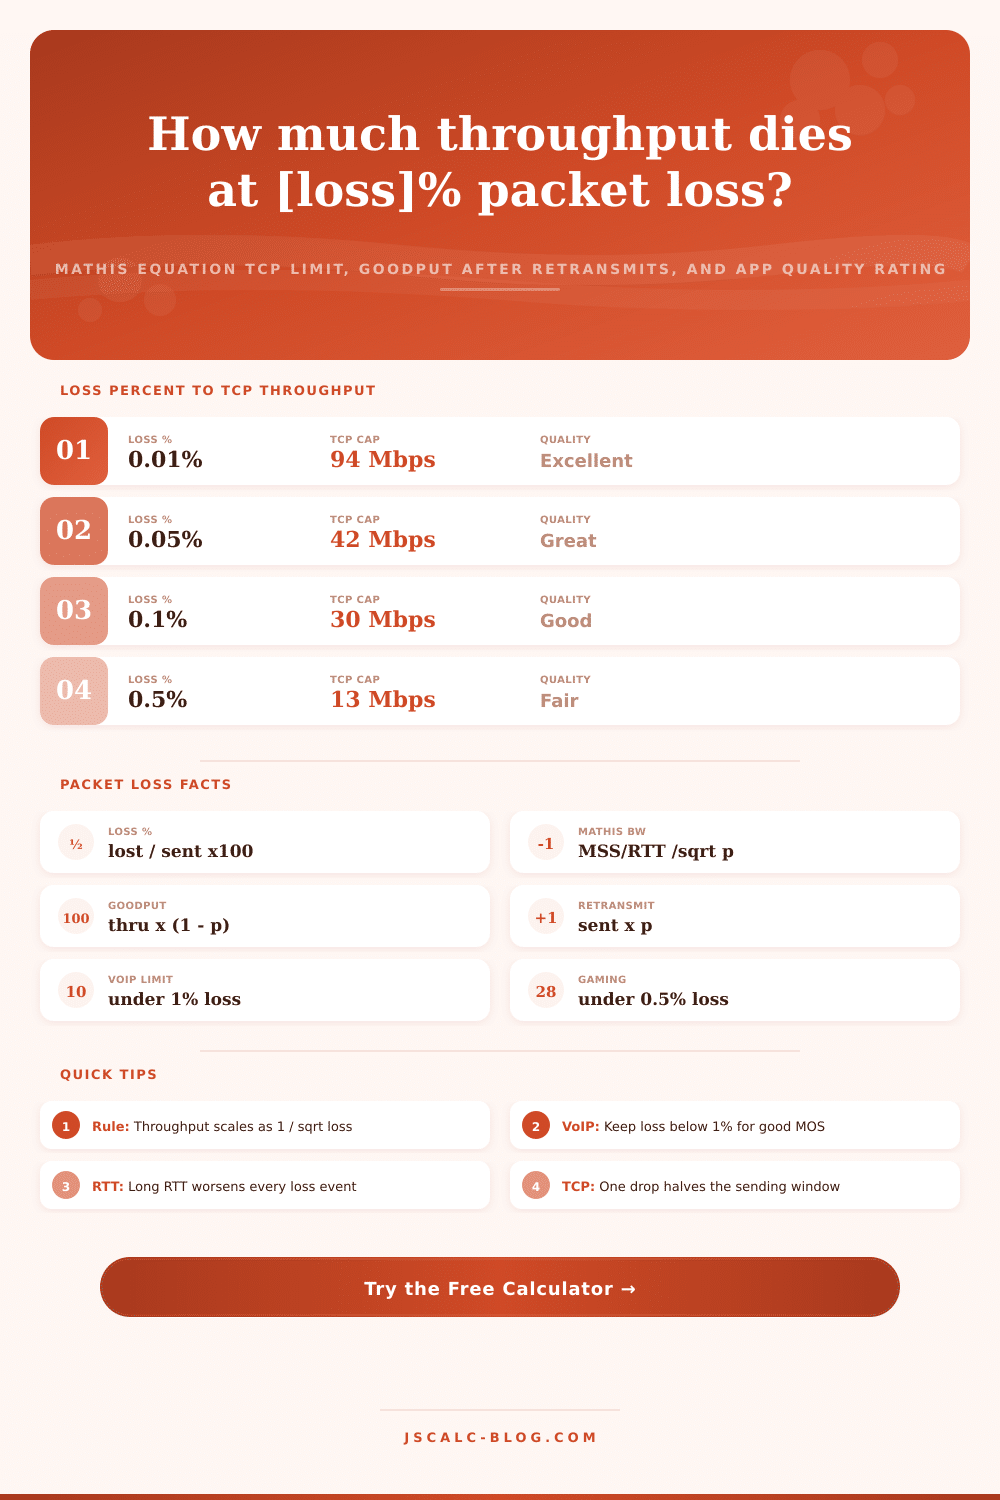
| 0.01% | 0.0001 | 100 | 94 Mbps | 100% |
| 0.05% | 0.0005 | 44.7 | 42 Mbps | 45% |
| 0.1% | 0.001 | 31.6 | 30 Mbps | 32% |
| 0.3% | 0.003 | 18.3 | 17 Mbps | 18% |
| 0.5% | 0.005 | 14.1 | 13 Mbps | 14% |
| 1% | 0.01 | 10 | 9.4 Mbps | 10% |
| 2% | 0.02 | 7.07 | 6.6 Mbps | 7% |
| 3% | 0.03 | 5.77 | 5.4 Mbps | 6% |
| 5% | 0.05 | 4.47 | 4.2 Mbps | 4% |
| 10% | 0.10 | 3.16 | 3.0 Mbps | 3% |
🌐Tolerable Loss by Application
| Application | Ideal Loss | Usable Limit | Breaks Above | Why It Matters |
|---|---|---|---|---|
| Bulk file transfer | Under 0.1% | 1% | 3% | Mathis caps throughput hard |
| VoIP voice | Under 0.5% | 1% | 3% | Choppy audio and dropouts |
| Video conferencing | Under 0.5% | 1.5% | 5% | Frozen frames, artifacts |
| Live video streaming | Under 1% | 2% | 5% | Buffering and quality drops |
| Online gaming | Under 0.2% | 0.5% | 2% | Rubber-banding, missed hits |
| Web browsing | Under 0.5% | 2% | 8% | Slow page loads, retries |
| Cloud gaming | Under 0.1% | 0.5% | 1.5% | Input lag and stutter |
🔧Common Causes of Packet Loss
| Cause | Where It Happens | Typical Signature | First Fix to Try |
|---|---|---|---|
| Link congestion | Saturated uplink or ISP | Loss rises at peak hours | Add capacity or shape traffic |
| Wi-Fi interference | Wireless last hop | Bursty loss, retries climb | Change channel, move closer |
| Faulty cable or port | Physical layer | Steady loss plus CRC errors | Swap cable, reseat, test port |
| Overloaded router | CPU-bound device | Loss with high latency spikes | Reduce load or upgrade device |
| Buffer overflow | Queue at bottleneck | Tail drops under bursts | Enable AQM, size buffers well |
| Routing flap | Path changes upstream | Intermittent, path-dependent | Trace route, contact provider |
| MTU mismatch | Tunnels and VPNs | Large packets fail silently | Clamp MSS, enable PMTUD |
🗃Quality Comparison Grid by Loss Level
| Loss % | TCP Effect (Mathis) | VoIP MOS | Video | Gaming | Overall |
|---|---|---|---|---|---|
| 0.01% | Near line rate | 4.4 excellent | Crystal clear | Flawless | Excellent |
| 0.1% | ~32% of clean cap | 4.3 great | Smooth | Very good | Good |
| 0.5% | ~14% of clean cap | 4.0 good | Minor artifacts | Slight lag | Fair |
| 1% | ~10% of clean cap | 3.6 fair | Occasional freeze | Noticeable | Poor |
| 2% | ~7% of clean cap | 3.1 poor | Frequent stalls | Rubber-band | Bad |
| 3% | ~6% of clean cap | 2.8 bad | Choppy | Unplayable | Severe |
| 5% | ~4% of clean cap | 2.3 poor | Heavy artifacts | Broken | Broken |
| 8% | ~3.5% of clean cap | 1.9 bad | Mostly frozen | Broken | Unusable |
| 10% | ~3% of clean cap | 1.6 bad | Unwatchable | Broken | Dead |
⚙Formula Breakdown
💡Packet Loss Insights
Network performance is reduced by packet loss, something that can hide in plain sight even when your raw bandwidth look good. You might get a decent score on speedtest, but that doesn’t mean everything will work well when you make large downloads or call someone via video: some of your data simply won’t get there. That’s what this little tool above tells you: it measures your path and shows you your loss rate, then uses the Mathis equation to calculate how much your throughput is being reduced, and finally turns all these numbers in a simple quality rating for your traffic.
When you send data over a network, some of it may fail to arrive at its destination. The percentage that doesn’t make it is called packet loss. If I send one hundred thousand packets down a path and one hundred don’t make it, then my loss rate on that path is 0.1 percent. It sounds small, and it’s fine if your goal is getting a phone notification. However, if you’re trying to do a sustained TCP transfer, each drop will cause the protocol to react strongly, which will greatly impact performance.
Why Packet Loss Slows Down Your Internet
However, TCP assumes that any lost packets are due to congestion (not some random error), and therefore when it detects a drop, it reduces its congestion window approximately by half. It then increases the window gradually back up, in a sawtooth fashion. Frequent drops result in more window reductions, leading to a lower average sending rate. This means that even though the link might have plenty of physical bandwidth, a 1 percent loss can result in only a small fraction of this available rate. This happens because the loss eliminates most of the possible throughput, not just 1 percent.
The formula, developed by Matthew Mathis and his colleagues, explains how TCP throughput relates to loss. To find the maximum bandwidth, take the maximum segment size and divide it by the round trip time, then multiply that result by the inverse square root of the loss probability. The inverse square root is key; as loss gets smaller, it increases rapidly, but as loss goes up, it drops sharply, forcing the network to demonstrate its stability before pushing any more packets out.
The effect, however, is highly nonlinear: The throughput scales by the inverse square root of loss. That means halving the loss rate doesn’t increase throughput by just a small amount. Instead, halving the loss multiplies the throughput ceiling. In other words, cutting your loss rate from one percent to 0.25 percent cuts your probability to a fourth. This doubles your throughput ceiling because you took the square root of it. Lowering it another four times doubles your ceiling once more. While losing just a drop in a bucket would seem irrelevent, this is precisely what engineers pay attention to. Even a loss of a single percent or half a percent can cut your achievable throughput in half.
The Mathis cap is round-trip time divided by something, which is why latency makes it worse. This means distance also increases the issue. Shorter local paths can tolerate a certain level of packet loss much more than longer intercontinental paths. For instance, a 20 ms link could support roughly 58 Mbps per flow with only 0.1 percent loss, while increasing that same loss over a 150 ms transoceanic link decreases the limit down to 8 Mbps. Satellite connections in particular are very susceptible to loss; after all, they’re inherently disadvantaged in terms of throughput even without dropping any packets, and this calculator accommodates for this if you put your RTT in.
The tool calculates goodput, which is the portion of useful data carried by a connection rather than the overhead from resending every lost packet. It shows this as the throughput carrying genuinely new data. This does not count the overhead of retransmitting old bytes. At low loss, raw throughput and goodput are close together, but they start diverging as loss increases because sending packets again takes up some of the useful data rate, and fewer and fewer bytes is actually delivered effectively. It then plots the Mathis ceiling next to your link capacity, so you can see what’s really the bottleneck: the math or the math + your link?
Different types of traffic don’t react the same as loss: Real time apps like online games generally use UDP because waiting for retransmissions isn’t an option. Choppiness will show itself as lagged game play instead of slower transfer rates; voice becomes muddy at around 1 percent loss and drops off rapidly after that. To feel snappy enough for competitive gaming, loss must be less than a few tenths of a percent.
So if you’re trying this out, start with one of the presets appropriate to your situation, enter your packet counts and see how your connection stacks up. Take that and look at the reference table on the page. It gives you concrete data about what happens when loss increases from 0.1 to 5 percent. It drops the throughput of TCP like a stone. If you’re trying to size a link, or diagnose the cause of a slow download, this is useful information. If you want to explain to your colleague why 2 percent loss really does matter, here are the numbers. This makes something invisible obvious. And once you measure the right thing in networking, you can do something with those measurements.