Labor Probability Calculator
Estimate the statistical chance of spontaneous labor by a given gestational week, the cumulative odds of having already delivered, the chance of going past your due date, and your most likely delivery week from a published term-birth distribution.
🎯Common Labor Scenarios
📝Pregnancy Inputs
Completed weeks since last menstrual period.
0 to 6 days, so 39 weeks + 4 days.
Used when method is due date. Today is 2026-07-05.
🔢Method Snapshot
📊Cumulative Delivery by Week
| Completed Week | Cumulative Delivered | Still Pregnant | Your Position |
|---|---|---|---|
| Enter values above to build the cumulative curve. | |||
| Week Window | Share Born That Week | Running Total | Relative Peak |
|---|---|---|---|
| The per-week probability appears after calculation. | |||
🗂First vs Subsequent Baby Timing
| Group | Median Onset | By 39 Weeks | By 40 Weeks | By 41 Weeks | Reach 42 Weeks |
|---|---|---|---|---|---|
| First baby, single | 40w 5d | 34% | 55% | 82% | Around 6% |
| Later baby, single | 40w 3d | 45% | 68% | 90% | Around 3% |
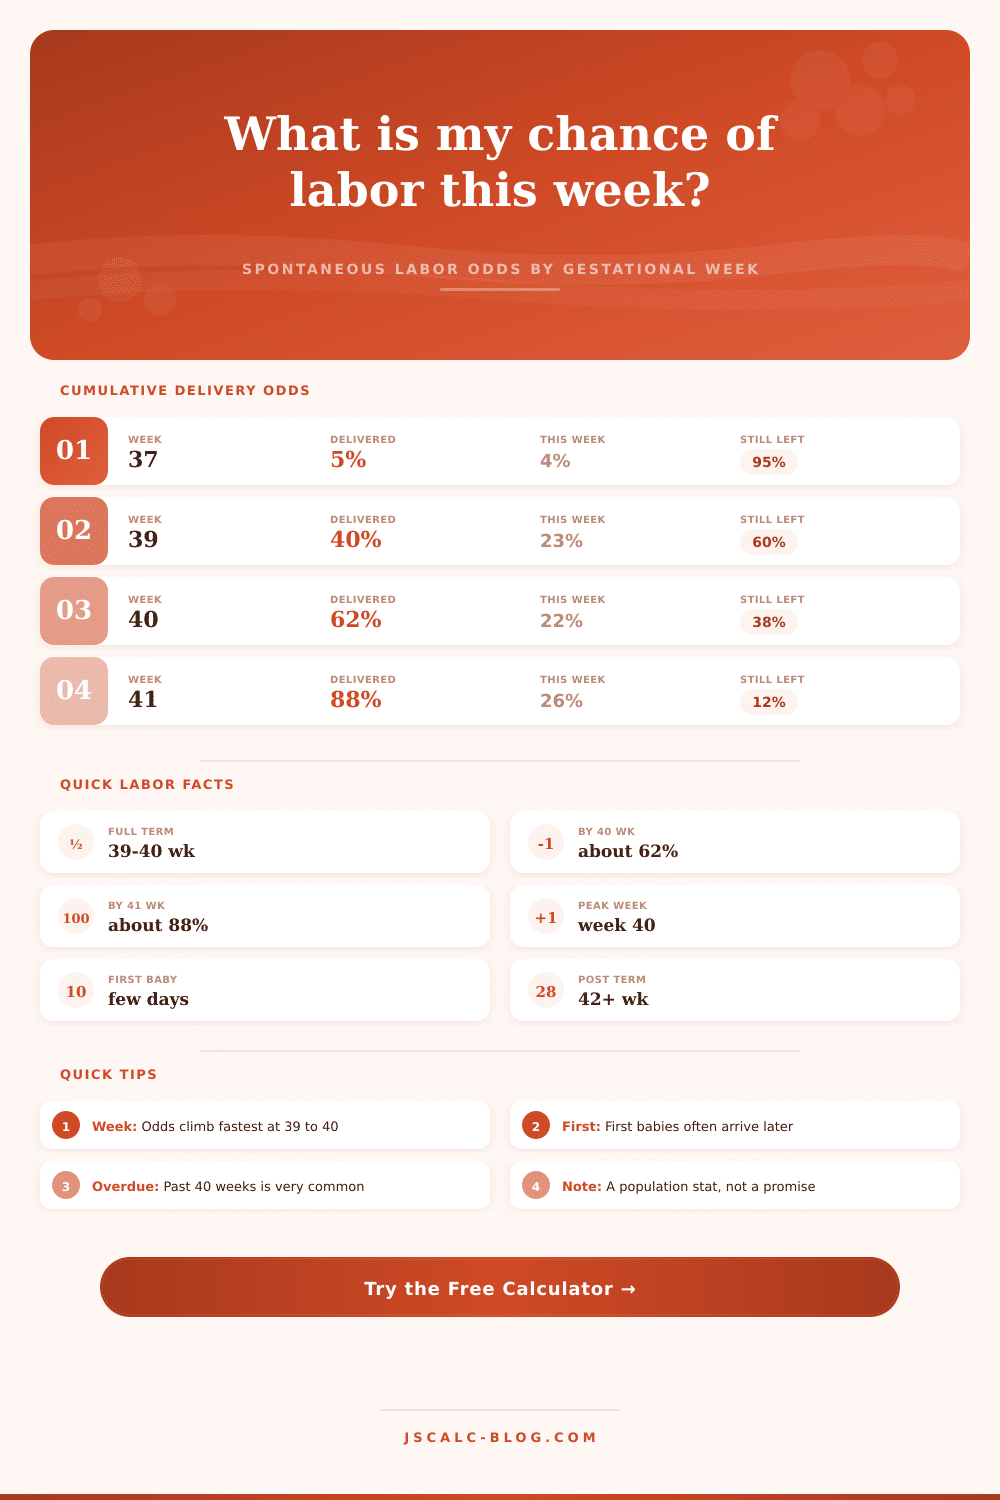
| Any single baby | 40w 4d | 40% | 62% | 88% | Around 4% |
| Twins (typical goal) | 36w 5d | 82% | 90% | 96% | Rare |
| Induced by policy | Varies | Set date | Set date | Uncommon | Uncommon |
| Prior early birth | Earlier | Higher | Higher | Lower | Lower |
📆Term Classification
| Label | Gestational Range | Day Range | Cumulative Delivered | Rough Share |
|---|---|---|---|---|
| Preterm | Before 37w 0d | Under 259d | About 3% to 4% | Under 1 in 10 |
| Early term | 37w 0d to 38w 6d | 259d to 272d | 4% up to 20% | Roughly 1 in 6 |
| Full term | 39w 0d to 40w 6d | 273d to 286d | 20% up to 62% | Largest group |
| Late term | 41w 0d to 41w 6d | 287d to 293d | 62% up to 88% | Roughly 1 in 4 |
| Post term | 42w 0d and beyond | 294d and up | 88% up to 100% | Small remainder |
⚙How the Estimate Is Built
📋Reference Distribution Values
| Milestone | Typical Value | How It Is Used | Effect On Result |
|---|---|---|---|
| By 37 weeks | About 5% delivered | Anchor at 259 days | Sets early-term baseline |
| By 39 weeks | About 40% delivered | Anchor at 273 days | Curve steepens here |
| By 40 weeks | About 62% delivered | Anchor at 280 days | Splits overdue share |
| By 41 weeks | About 88% delivered | Anchor at 287 days | Late-term catch-up |
| By 42 weeks | About 96% delivered | Anchor at 294 days | Post-term remainder |
💡Reading Your Odds
Week Thirty-Nine: “Now it’s not just the calendar that worries us. Now we’re worried about the internet, which tells us that labor will happen any moment now, except that it isn’t happening now. What is happening are unknown. And so what happens is that we start to make predictions, calculate risk.
We type in our due date and our parity number into this thing called the labor probability calculator. Is this silence dangerous? Is it normal? You don’t have to wonder because this number says so. It is a number from population data, not a number from fear. It is not a number from you. The numbers is statistics about groups, not people. Thirty percent does not tell you which women those thirty are. They’re still part of the group until they goes into labor.
Using Data to Feel Calm About Waiting
Understanding odds gives you information, but making a prediction require being sure. Knowing where you are within the distribution tells you what the data says. The tool takes published data and shows you where you are on it. It fills in how it shift from day to day so that the estimate isn’t just at whole numbers.
The calculator use your own pregnancy history as one of its inputs. In general, first time moms tend to wait a bit longer to go into spontaneous labor than second (or third, or fourth) timers. There’s nothing wrong with that… It’s just how our bodies work. For them the curve drop a little, taking that into account. And it doesn’t let you use it to compare yourself to other people whose history isn’t different than yours. Having twins flips things the other direction. The cervix get more pressure from carrying a pair of babies, which causes the curve to shift up and earlier.
Then there’s the due date. This is actualy 280 days from your last period. That puts you right around week forty. Forty weeks is the middle point, not the target date. About sixty-two percent of all single births result in a baby being born by week forty. More than one-third of babies is still cooking beyond their due dates. The calculator helps with that.
It helps us understand that going over is simply statistic. If the baby doesn’t come on time, many of us feel like we’ve failed. But the numbers tells a different story.
Keep in mind one warning about using this tool: it displays cumulative versus weekly odds. Cumulative is the number of women that have given birth at this point; while weekly is the percentage of women still pregnant who will likely go into labor within the next week. Because there are a lower and lower number of women left to deliver, the weekly odds climb faster then the cumulative ones. As you can see from the graph, the percent of women still waiting to give birth really decreases by week forty-one. That makes sense because as time move closer to the typical due date, the body prepares itself to do what it does best.
They’re not a prescription of what to expect… They’re a description of how probable it is. Contractions won’t necessarily start on time, or even happen, just because the water breaks on time. Every woman’s experience vary biologically; no one model knows for sure. What matters is perspective. If the weekly odds are low, it’s normal to wait longer. If the total % is high, there’ve been plenty of deliveries already, yours might come soon.
It makes waiting feel more real and visible. Work doesn’t have an end date, and no one wins the labor-race. Labor has its schedule; a biological schedule, which you can’t rush or speed up. The calculator provides a sense of where everyone tend to be on their biological clock. But it’s not the decider. Your body will let you know when it’s ready.
And knowing the numbers can help you wait more patienty and with less panic. Because “late” is frequently just normal variation. When you embrace the uncertainty, waiting won’t feel like failing at something anymore. Instead, it’ll feel like time ticking by until the baby come.”