Disk Read Write Time Calculator
Estimate how long a file copy, backup, or clone actually takes. Enter the data size, pick a drive or interface with real sequential MB/s, apply a real-world efficiency, and get transfer time in hours, minutes, and seconds for both the read leg and the write leg, plus effective throughput and files per second.
⏳Real Transfer Presets
💾Transfer Inputs
Total amount of data you are copying or writing.
Base 1024: 1 GB = 1024 MB, 1 TB = 1024 GB.
Writes are usually a touch slower than reads.
Sets the rated sequential speed automatically.
Peak sequential MB/s from the spec sheet.
Sustained speed as a share of rated, usually 70-90%.
Burst adds a small cache boost for short jobs.
Many small files add per-file overhead.
Seek and open cost per file, near 0 on SSD, higher on HDD.
Rounding for throughput and per-file numbers.
🔢Formula Snapshot
📊Interface Comparison Grid
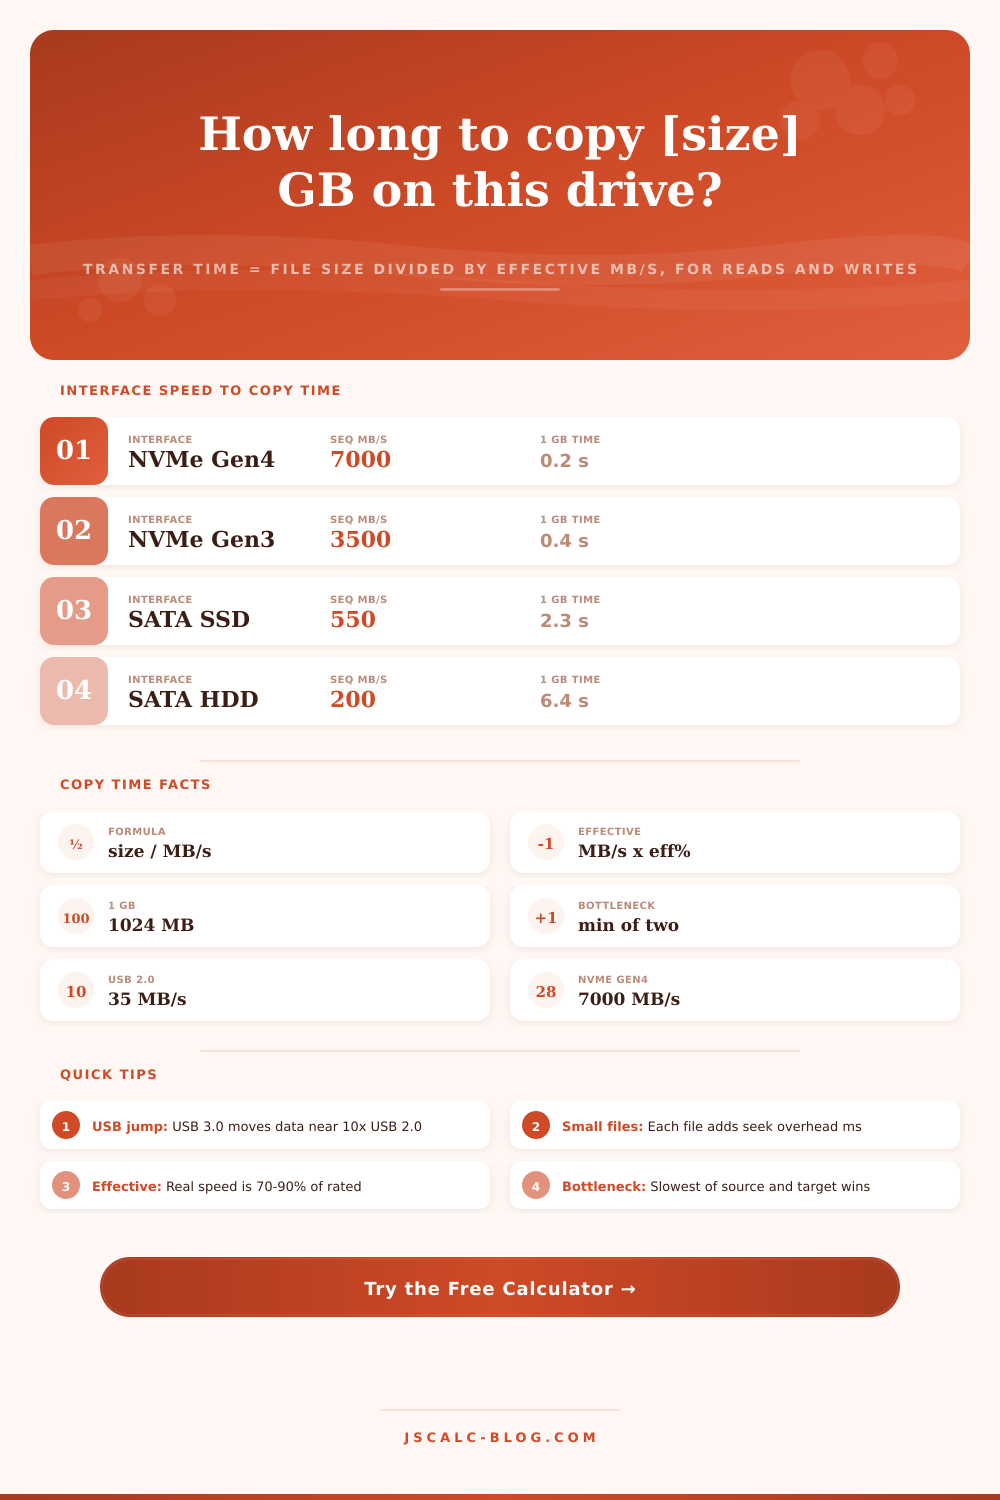
| Interface | Seq MB/s | Time 1 GB | Time 100 GB | Time 1 TB | Notes |
|---|---|---|---|---|---|
| NVMe Gen4 SSD | 7000 | 0.15 s | 15 s | 2.5 min | M.2 PCIe 4.0 x4 |
| NVMe Gen3 SSD | 3500 | 0.29 s | 29 s | 5.0 min | M.2 PCIe 3.0 x4 |
| SATA III SSD | 550 | 1.9 s | 3.1 min | 31 min | 2.5 inch, 6 Gb/s bus |
| SATA III HDD | 200 | 5.1 s | 8.5 min | 1.4 h | 7200 rpm spinning disk |
| USB 3.0 drive | 450 | 2.3 s | 3.8 min | 39 min | USB 3.2 Gen 1, 5 Gb/s |
| USB 2.0 drive | 35 | 29 s | 49 min | 8.3 h | Old 480 Mb/s port |
| 1 GbE network | 112 | 9.1 s | 15 min | 2.5 h | Gigabit LAN, ~940 Mb/s |
| 2.5 GbE network | 280 | 3.7 s | 6.1 min | 1.0 h | Multi-gig LAN |
Times assume 100% efficiency and base-1024 sizes for a clean comparison; real copies run 10-30% longer.
🖥Common File Sizes and Copy Time
| File or Job | Size | On SATA SSD | On USB 2.0 |
|---|---|---|---|
| Photo JPEG | 8 MB | 0.01 s | 0.23 s |
| Song MP3 | 10 MB | 0.02 s | 0.29 s |
| App installer | 500 MB | 0.9 s | 14 s |
| HD movie | 4 GB | 7.4 s | 1.9 min |
| DVD ISO | 4.7 GB | 8.7 s | 2.3 min |
| Blu-ray rip | 25 GB | 46 s | 12 min |
| Game install | 80 GB | 2.5 min | 39 min |
| Full backup | 500 GB | 15 min | 4.1 h |
🔧Efficiency and Overhead Reference
| Scenario | Typical Efficiency | Per-File Overhead | Why |
|---|---|---|---|
| One big sequential file | 90% | ~0 ms | No seeks, steady stream |
| SSD, mixed files | 85% | 1-2 ms | Fast random access |
| HDD, mixed files | 70% | 8-15 ms | Head seek per file |
| Thousands of tiny files | 40% | 2-10 ms | Overhead dominates |
| Network share (SMB) | 75% | 3-8 ms | Protocol round trips |
| USB flash, small files | 50% | 5-20 ms | Slow controller |
⚙Formula Breakdown
💡Speed Up Your Transfers
Have you ever wanted to back up your files? Do you want to move your game library over to another drive? Do you want to clone a drive? Well now there’s Disk Read Write Time Calculator, which estimates time it’ll take based off the size of data and speed of slowest part of process.
For instance, if you’re transferring 1TB from your external hard drive to your internal SSD, it’ll use speed of that external hard drive (not the SSD). The calculator give you seconds/minutes/hours. It considers real-world factors like things that can slow down speeds beyond what is written on box.
How to Use the Disk Read Write Time Calculator
At its simplest level, sequential transfer time is just that: if it takes 3.5 minutes to make a copy of something, and the rate is 500 megabytes per second then the amount of data are about 100 gigabytes. All of the other features in the calculator are refinements of this base case. Getting the throughput and size right will give you an accurat answer.
The speed you see on a spec sheet is idealized lab conditions, not how your machine perform under normal use. Know what you’re measuring. The spec sheets quote peak sequential speeds in ideal circumstances with a single large file and no background activity. Actual transfers is never as good. Overhead from the filesystem, background tasks, thermal throttling, and updating the file table will slow things down. The calculator has a real-world efficiency field to account for that.
A reasonable default for a moddern SSD transferring mixed data is 85 percent. A spinning hard drive doing lots of files might reaches just 70 percent of its rated speed. Multiply the rated speed by efficiency to get effective throughput, that’s what you should of expect on your progress bars.
Under a drop-down in the interface are the speed steps for all these different devices and connections. SATA III SSDs will max out at roughly 550 megabytes per second (their bus is limited). NVMe Gen4 drives pushes that up to around 7000. A good 7200 rpm SATA drive runs closer to 200 megabytes per second on average. Speeds to external drives vary by port. Data transfers at roughly 450 megabytes per second through USB 3.0, but if you have one of those old USB 2.0 ports, it’s only 35, a 10x penalty that catches many people off guard. Standard gigabit Ethernet tops out at roughly 112 megabytes per second, again taking into account protocol overhead. Choose your gear, and the calculator figures it out.
Note that read and write speeds differ. In general, writing is slower then reading (you have to update the metadata and commit the data to the storage cells). You can model in both directions with the operation dropdown. The results panel display a combined read-then-write total. Copying from one drive to another mean stacking two operations, which is what accounts for the difference when comparing a single-file read vs. A disk-to-disk copy. The bottleneck will be the slower of the two device.
The number of files can be one transfer surprise that has nothing to do with raw speed. If it’s one big 40-gigabyte video file, that moves quickly (the data flows continuously). But if it’s 40 gigs in half a million little file, then you’re opening, seeking, closing, etc., for every little file, adding fixed costs. That is what the per-file overhead and number-of-files input do to the calculator model.
Even at 2 milliseconds apiece, 100,000 files will add 200 seconds of overhead before data even starts flowing. And if those seeks are expensive (as they are on spinning hard drives), that overhead may dwarve the actual transfer time.
Fast caches: Rated sustained speeds is often shorter than how long it actually takes to copy files in a short amount of time. Lots of SSDs has a high-speed pool that buffers rapid writing at max speed before overflowing the cache. That’s why you see this difference between sustained and burst. For a brief copy, use burst to add a bit more speed. For long backups with an emptying cache, use sustained. That way, your estimate will be accurate.
What these numbers show is how you can speed up transfers. First, make sure to use a fast port: a blue USB 3 socket (versus black USB 2). That alone can cut it down by factor of ten. Also, for folders of many little files, archive them in advance into a single zip file, making the copy act like a single sequential stream.
Keep in mind that the speed limit is set by the destination. You cannot copy fast if the source is fast and target is slow. Pick a preset and tweak the inputs until they reflect what’s in your gear and you’ll have an idea of the length of the copy before clicking start.