Deduplication Savings Calculator
Turn a deduplication ratio such as 10:1 into the numbers that matter: savings percent, space saved, the physical size actually stored, and how much logical data your array can effectively hold. Enter the ratio directly or derive it from a stored size, then stack post-dedup compression to see the combined effect on capacity.
📉Choose an Input Mode
🎯Real Workload Presets
📝Deduplication Inputs
Total front-end data written by hosts and applications.
Applies to logical, stored, and array capacity fields.
10 means 10:1, so ten units in for every one stored.
Actual unique data on disk; ratio is derived from this.
Picking a workload loads its typical starting ratio.
Stacks on dedup; use 1 for none, 2 for a 2:1 squeeze.
Physical usable space; shows effective logical capacity.
Controls rounding on the result cards.
🔢Formula Snapshot
📋Ratio to Savings Percent Equivalence
| Dedup Ratio | Savings % (1 - 1/R) | Stored per 1 TB Logical | Reads As |
|---|---|---|---|
| 2:1 | 50% | 500 GB | Half removed |
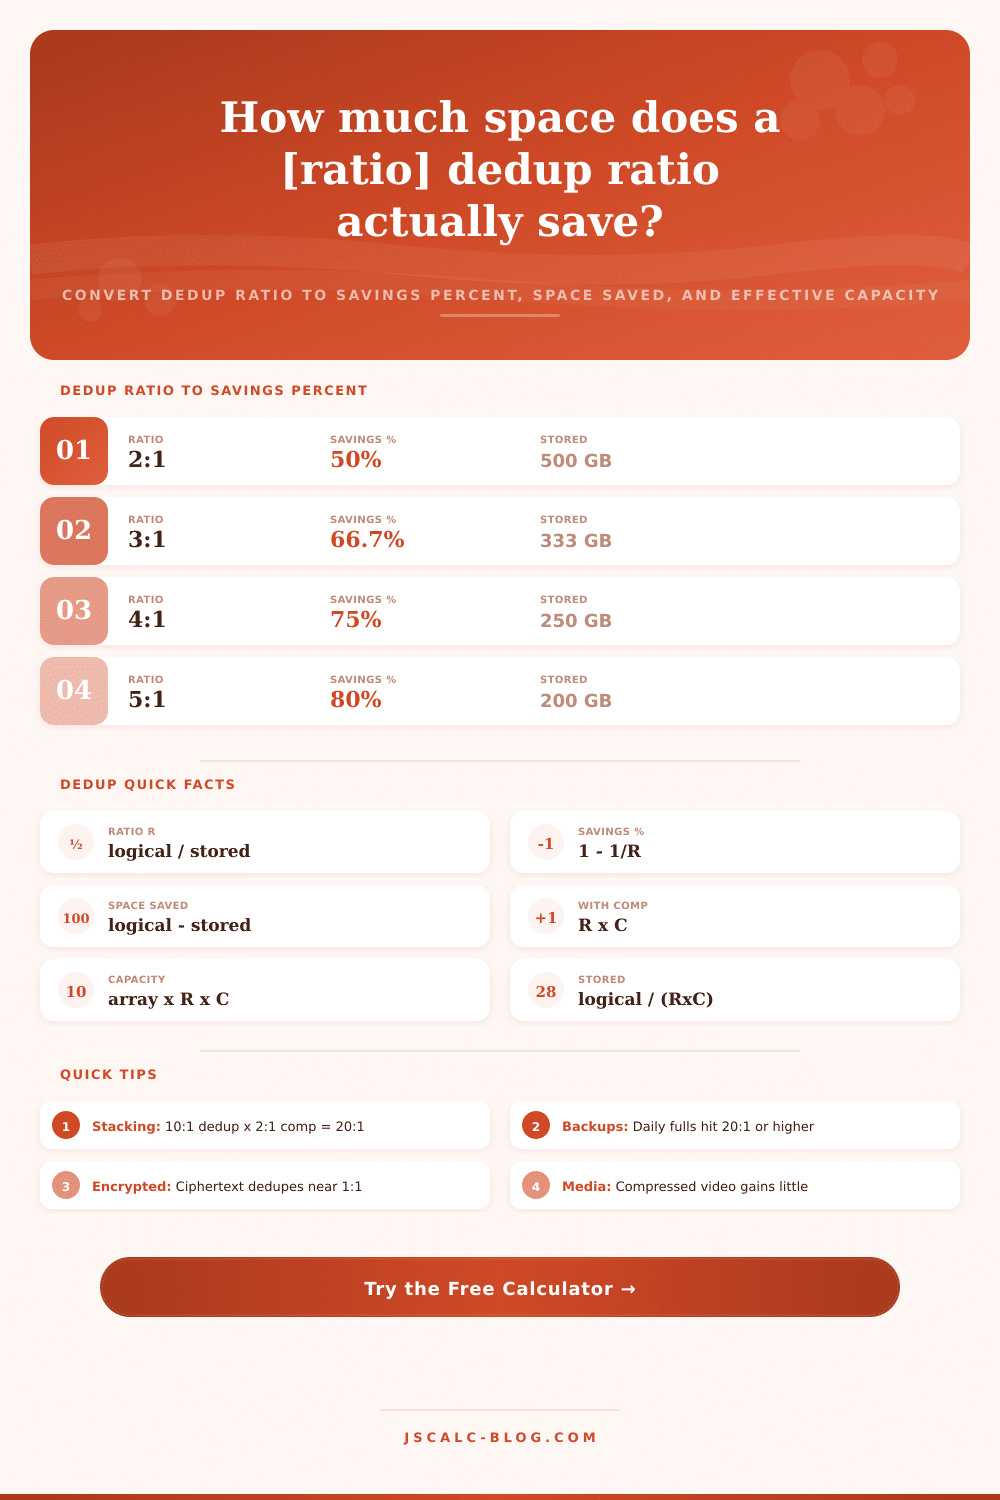
| 3:1 | 66.7% | 333 GB | Two thirds gone |
| 4:1 | 75% | 250 GB | Three quarters gone |
| 5:1 | 80% | 200 GB | Four fifths gone |
| 10:1 | 90% | 100 GB | Nine tenths gone |
| 15:1 | 93.3% | 66.7 GB | VDI territory |
| 20:1 | 95% | 50 GB | Backup territory |
| 50:1 | 98% | 20 GB | Extreme redundancy |
| 100:1 | 99% | 10 GB | Near duplicate data |
🗃Workload Deduplication Comparison Grid
| Workload | Typical Dedup Ratio | Savings % | Compression Adds | Combined Ratio | Notes |
|---|---|---|---|---|---|
| VDI desktops | 15:1 | 93.3% | 1.5:1 | 22.5:1 | Golden image shared widely |
| Virtual machine images | 8:1 | 87.5% | 1.5:1 | 12:1 | Shared OS and libraries |
| File server | 3:1 | 66.7% | 2:1 | 6:1 | Office docs and shares |
| Database live data | 2:1 | 50% | 2:1 | 4:1 | Low block repetition |
| Email and messaging | 4:1 | 75% | 1.5:1 | 6:1 | Repeated attachments |
| Daily full backups | 20:1 | 95% | 1.5:1 | 30:1 | Same data captured nightly |
| Media and video | 1.3:1 | 23.1% | 1.05:1 | 1.37:1 | Already compressed |
| Encrypted volumes | 1.05:1 | 4.8% | 1:1 | 1.05:1 | Ciphertext looks random |
📊Space Saved on a 10 TB Logical Set
| Dedup Ratio | Physical Stored | Space Saved | Savings % |
|---|---|---|---|
| 2:1 | 5 TB | 5 TB | 50% |
| 4:1 | 2.5 TB | 7.5 TB | 75% |
| 5:1 | 2 TB | 8 TB | 80% |
| 8:1 | 1.25 TB | 8.75 TB | 87.5% |
| 10:1 | 1 TB | 9 TB | 90% |
| 20:1 | 0.5 TB | 9.5 TB | 95% |
| 50:1 | 0.2 TB | 9.8 TB | 98% |
⚙Formula Breakdown
💡Deduplication Planning Tips
You’ll see deduplication ratios of twenty-to-one or even fifty-to-one mentioned in storage team discussions. Those numbers sound great on a datasheet, but a ratio doesn’t tell you how much disk space was actualy saved. To understand your disk savings, you want to know the percentage of disk saved, physical disk footprint it takes up, and what your new effective capacity multiplier is with compression factored in. The calculator above convert those numbers for you. It translates vendor’s abstract claims into concrete capacity numbers that guide purchasing decisions.
Instead, deduplication identifies blocks that is identical, stores each different block just once, and any subsequent copies point back to the original. That ratio (R) equals logical data written divided by physical data stored. In other words, if you have a set of host writing one thousand gigabytes, and the system only has to store one hundred gigabytes worth of different blocks, then you have a ratio of ten. You would say: “ten-to-one”. The greater the ratio, the more repetition it has found. It also has had less physical capacity to use.
Why You Should Care About Savings, Not Just Ratios
The math isn’t complicated: it’s simply a matter of division. What gets tricky is in how we interpret it. So what’s the number we really care about? It’s the savings percent. And this comes straight from the ratio itself: One minus one over R. If R = 2, that’s a two-to-one ratio and it saves half (fifty percent). If R = 5, that’s a five-to-one ratio and it saves four-fifths, or eighty percent. And if R = 10, that’s a ten-to-one ratio and it saves nine-tenths, or ninety percent.
Here’s how the curve works: At the lower end, the percentage jumps sharply. At the higher end, it levels off. You gain three points by moving from a twenty-to-one to a fifty-to-one ratio. But you gained thirty points by moving from a 2:1 ratio to a 5:1 ratio. So if you’re already beyond the ninety percent mark, which means you’ve been chasing an ever-larger ratio, you gets diminishing returns.
Ratios and percentages are relative measures; budgets is measured in terabytes. Logical data minus stored data equals space saved. If a thousand gigabyte set of data gets deduped ten-to-one, that’s one hundred gigabytes of stored data on a one-thousand-gigabyte dataset. That’s nine hundred gigabytes of space saved. This becomes important in hardware-sizing situations. It isn’t simply “buy less disk.” Instead, you must buy enough disk for the actual stored data rather than the logical data. With this kind of tool you can type in the logical size/ratio and the tool will tell you precisely how much physical drive space you should of had so you don’t over-purchase.
Most moddern storage arrays run compression after deduplication, and the two effects multiply rather than add. Dedupe plus compression are multiplicative, not additive. A ten-to-one dedup times a two-to-one compression will combine for a twenty-to-one ratio. That means that the stored size is logical data divided by the aggregate ratio. If dedup delivers a ten-to-one ratio and compression adds another two-to-one, one thousand gigabytes shrinks to fifty gigabytes. Even a relatively mild compression of, say, 1.5 to 1, can significantly increase the combined number. And remember: ratios compound, so that little bit saves a lot of disk space over time.
What’s the output from all this? The one that’s most useful for planning is the effective capacity multiplier. When the array has data reduction enabled, it doesn’t just hold as much as was rated. It holds that much times the combined ratio. If your array is rated at ten terabytes and runs a combined ratio of 20:1, then it’ll hold about two-hundred terabytes of logical data. This helps express the abstract ratio in concrete form: How much data will I really be able to put on here without having to add another shelf?
Your deduplication ratio is completely driven by the repetition in your data. Since backup repos are the champions, a nightly full backup will capture basically the same information as yesterday’s. Office document file servers tends to be around three-to-one. But because they have very similar OS blocks (think virtual desktop pool created from a single golden image), they do dedup realy well.
Databases are a different story, the higher the block turnover, the lower the dedup. It might be two-to-one for a live database volume. And not everything dedups and compresses effectively. There is very little redundancy at the block level in JPEG and MP4 photos and videos, since that content is already compressed. So, their ratios tends to be closer to one-and-a-half-to-one.
Even worse, encrypted data isn’t particularly amenable, either, because good encryption makes the resulting ciphertext appear statistically random. The same plaintext block generates entirely different blocks of ciphertext. The result: your ratios will crash to one-to-one. If most of your environment consists of pre-compressed media or encrypted volumes, plan for capacity based off the raw number of bytes. Consider any savings as gravy instead of part of your design.
So, how do these ratios make things look so rosy? Because, well…you’re not looking at what they’re measuring.