CPU vCore Voltage Calculator
Estimate the core voltage a target overclock needs from a voltage-frequency curve, subtract Load-Line Calibration droop to find the real Vcore under load, compare heat and power with the P = C V squared f relationship, and check your voltage safety margin against a daily limit.
💻Real Overclock Scenarios
📝Voltage and Clock Inputs
Default core voltage at the stock boost clock.
All-core clock that the base Vcore holds.
The all-core overclock you are aiming for.
Extra Vcore each 100 MHz needs, ~0.010-0.025 V.
Higher LLC holds Vcore up under heavy load.
Used only when LLC is set to Manual droop.
Recommended ceiling, often 1.35-1.40 V.
Used to scale estimated power at the new clock.
🔢Formula Snapshot
📈Voltage-Frequency Curve Sample
| Frequency | Above Stock | Extra Vcore | Typical Set Vcore |
|---|---|---|---|
| 4000 MHz | Stock | +0.000 V | 1.250 V |
| 4200 MHz | +200 MHz | +0.030 V | 1.280 V |
| 4400 MHz | +400 MHz | +0.070 V | 1.320 V |
| 4600 MHz | +600 MHz | +0.120 V | 1.370 V |
| 4700 MHz | +700 MHz | +0.150 V | 1.400 V |
| 4800 MHz | +800 MHz | +0.185 V | 1.435 V |
| 5000 MHz | +1000 MHz | +0.260 V | 1.510 V |
| 5100 MHz | +1100 MHz | +0.305 V | 1.555 V |
🛡Safe Vcore Limits by CPU Family
| CPU Family | Daily Safe Vcore | Short Peak | Notes |
|---|---|---|---|
| Ryzen 5000 (Zen 3) | 1.30 - 1.35 V | 1.40 V | All-core load stays cooler low |
| Ryzen 7000 (Zen 4) | 1.30 - 1.35 V | 1.40 V | Runs hot, watch package temp |
| Intel 10th/11th Gen | 1.35 - 1.40 V | 1.45 V | Adaptive voltage recommended |
| Intel 12th Gen | 1.35 - 1.40 V | 1.45 V | P-cores drive the voltage need |
| Intel 13th/14th Gen | 1.30 - 1.40 V | 1.45 V | Keep loadline modest for life |
| Older Ryzen 3000 | 1.32 - 1.37 V | 1.42 V | Single core boosts higher |
📡LLC Level Effect on Vdroop
| LLC Level | Droop Amount | Set 1.30 V → Load | Behavior |
|---|---|---|---|
| LLC 1 (very low) | ~120 mV | 1.180 V | Large sag, safest for VRM |
| LLC 2 (low) | ~90 mV | 1.210 V | Noticeable droop under load |
| LLC 3 (medium) | ~65 mV | 1.235 V | Balanced, common default |
| LLC 4 (high) | ~45 mV | 1.255 V | Good for stress stability |
| LLC 5 (very high) | ~25 mV | 1.275 V | Small droop, watch overshoot |
| LLC 6 (extreme) | ~10 mV | 1.290 V | Near flat, risk of spikes |
🗃Vcore, Clock, Power and Heat Comparison Grid
| Scenario | Vcore | Frequency | Power Ratio | Est Power | Safety |
|---|---|---|---|---|---|
| Stock baseline | 1.250 V | 4000 MHz | 1.00x | 105 W | Safe |
| Mild OC | 1.300 V | 4300 MHz | 1.16x | 122 W | Safe |
| Moderate OC | 1.350 V | 4500 MHz | 1.31x | 138 W | Safe |
| High OC | 1.400 V | 4700 MHz | 1.47x | 154 W | Caution |
| Aggressive OC | 1.450 V | 4900 MHz | 1.65x | 173 W | Caution |
| Extreme OC | 1.500 V | 5000 MHz | 1.80x | 189 W | Danger |
| Benchmark push | 1.550 V | 5100 MHz | 1.96x | 206 W | Danger |
| Efficient undervolt | 1.180 V | 4000 MHz | 0.89x | 94 W | Safe |
⚙Formula Breakdown
💡Vcore Tuning Tips
If there’s one question every overclocker asks first, it’s answered by the CPU vCore voltage calculator. How much core voltage does my target clock speed require? Is this voltage even safe? Vcore (aka Core Voltage) is the single dial that decides whether a frequency is stable, how much heat the chip throws and how long the silicon lasts.
This tool takes a basic curve and estimates your required Vcore. It accounts for Load-Line Calibration droop to show you what really gets to the cores under load. It then multiplies by power using the fundamental P = C V squared f relation. Finally, it compares total to a safe ceiling for your day to ensure you never fly blind.
How to Use the CPU Voltage Calculator
A CPU’s dynamic power (P) are proportional to V squared times C times f. So the important part: Voltage is squared. That means voltage scale power by the square. Frequency scales power linearly. You want to increase voltage a bit? Increase voltage. That will cause much greater increases in current and heat than increasing frequency by the same amount. Pushing a 1.3V system up to 1.4V might only be an 8-ish percent voltage increase, but that’s around 16 percent more heat at an equal clock speed. In other words, good tuning use the minimum voltage possible while maintaining stable frequency. It’s a little thing, but your thermals will thank you.
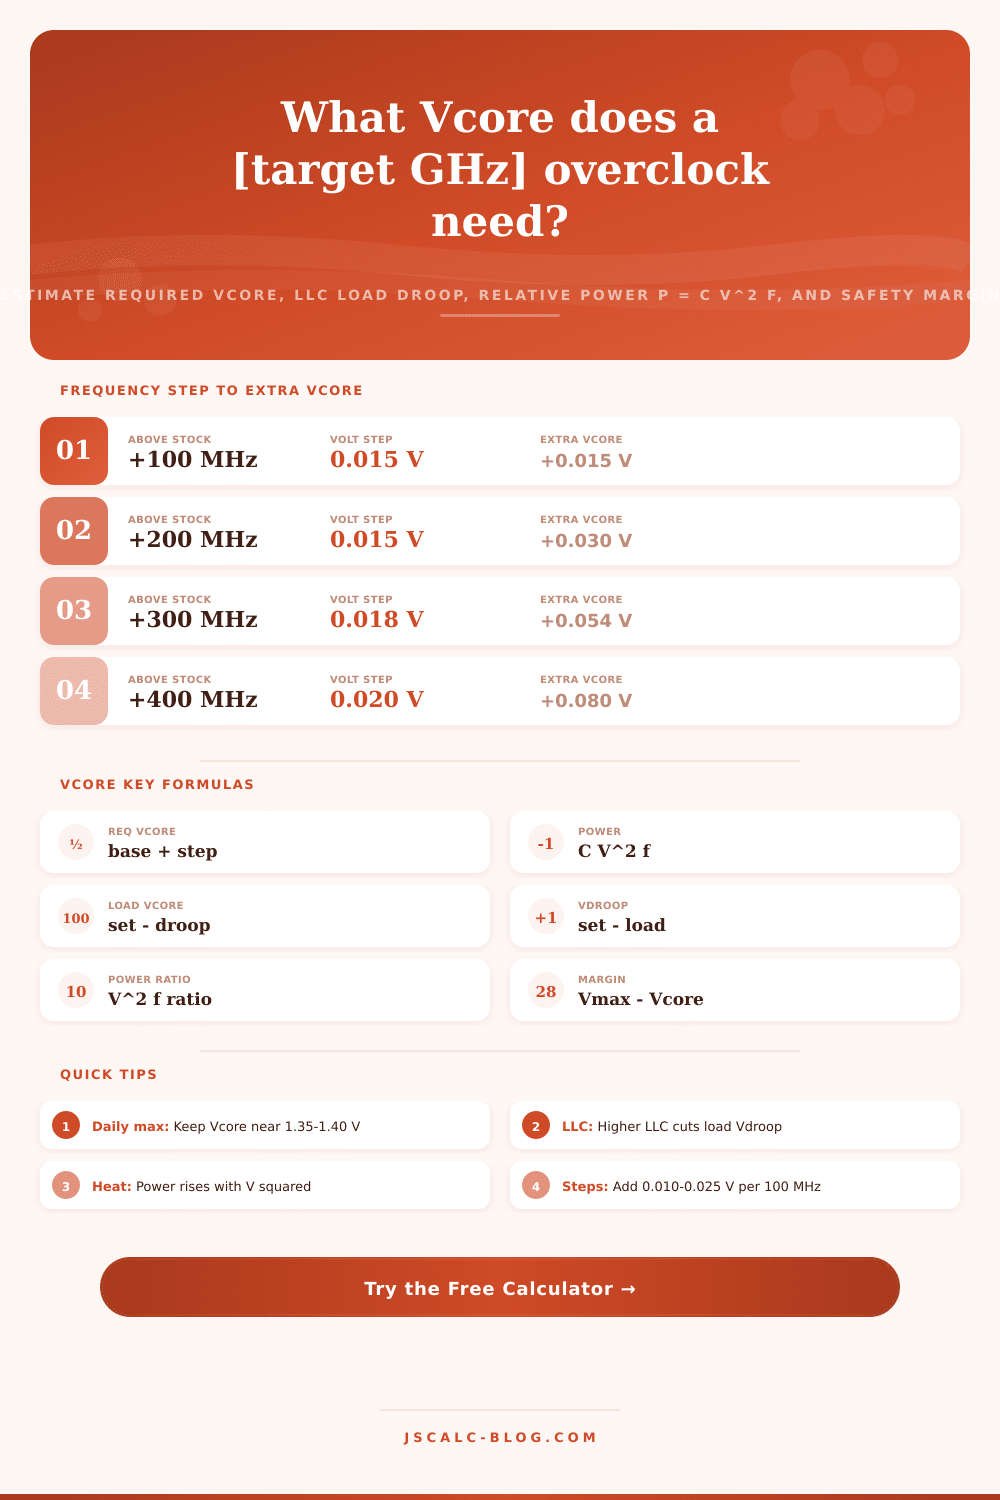
Each chip has a voltage versus frequency curve. Frequency curve. When they’re closer to stock, typically about every 100 MHz require another 0.010 to 0.025 volts of Vcore, though this is sometimes more and often less. The curve gets steeper as it approaches limits of the silicon.
The calculator’s model assumes this simple relationship: Required Vcore = BaseVcore + #ofstepsabovestock x voltsperstep (a value that you set). So setting base Vcore to 1.250 volts at 4000 MHz, and wanting 4700 MHz with 0.020 volts per step, gives us seven steps for an additional 0.140 volts, which should land around 1.390 volts. The per-step value is an adjustable part of the equation, so after measuring two or three stable points on your particular chip you can adjust it to match.
When a core is under a heavy all-core load it see a different voltage than what’s set in BIOS. That difference is called Vdroop, because as current spikes, the delivered voltage sags. LLC (Load-Line Calibration) corrects that voltage sag to bring it back toward the set point. So the higher the LLC, the less the voltage will sag (less droop). With the calculator, you choose an LLC level ranging from something like 120 mV droop at a very low setting to nearly 0 mV droop at an extreme setting. It calculates load Vcore as (set voltage) minus (LLC droop). And now we know actual voltage being seen by the core when it’s under load.
You can see how two guys might have both set their core voltage to 1.35 V, but one has an LLC setting that gives him 200 mV of sag while the other has an LLC setting that only delivers 50 mV of sag. There are four cards that sum it up.
The first two are Estimated required Vcore, which you’d set in your BIOS. The next is Load Vcore after droop, which is how much will actualy reach your cores when you apply LLC.
The second card show relative power compared to stock, which is taken directly from the P = C V squared f ratio. That’s why the last two columns are a percentage and also an estimate of watts that would be based off scaling from your TDP at stock.
The final card is Voltage safety margin which subtracts your set Vcore from a safe daily ceiling. This color codes the result as either SAFE, CAUTION, or DANGER. So it makes an otherwise abstract number turn into a clear go/no-go signal.
Generally speaking, most of today’s desktop CPUs uses about 1.35-1.40 V every day. (Some Intel gens do well at up to ~1.40 V with adaptive voltage; some Ryzen chips from Zen 3/4 like to hang out closer to 1.30-1.35 V during sustained all-core loads due to their high temperatures, while others still.) The page has reference tables by CPU family that you can use as help for setting a reasonable maximum. Think of headroom as “a positive margin”; good!, but “margin of ~zero” means you’re pushing it.
Then there’s the comparison grid. A bunch of scenarios are lined up next to each other. They show the Vcore, frequency, power ratio, estimated wattage, and safety verdict. As you read downward in the grid, you can see how the squared voltage penalty works: Adding just 0.15 V to a moderate 1.35 V tune almost doubles the power draw. But it also gives you a clear picture of the curve so you know if it’s worth it for those last 100 MHz, heat and long-term wear be damned.
So you can get up and running near your hardware by loading presets which contain real-world overclock scenarios. Select the one closest to your chip, adjust target clock, base Vcore, volts per step and LLC to match your silicon and let ‘er rip. If you know exactly what your parameters are, just plug them into the calculator above and it’ll do the math for ya.
Use a preset as a starting point. Monitor the safety margin and bump up the voltage in small increments while stress testing. Keep doing this until you hit your target frequency’s lowest stable Vcore. Better to have a cool running but stable system rather than an unstable one pushing numbers.