CPU Performance Per Watt Calculator
Turn a raw benchmark score and a power figure into an efficiency rating with perf per watt = score divided by watts. Compare two chips head to head, see which one wins per watt even when its absolute score is lower, and estimate the energy each processor burns per benchmark run and across a full year of use.
🎯Real CPU Efficiency Presets
💻Chip A and Chip B Inputs
Labels the score; both chips must use the same test.
Higher point total from the selected benchmark.
Package power under load, or rated TDP.
Used for a blended average power estimate.
Score of the chip you are comparing against.
Package power under load, or rated TDP.
How long one benchmark pass takes on chip A.
Share of hours at full load vs idle for chip A.
Hours the machine runs per year (energy math).
For yearly running-cost context on chip A.
🔢Formula Snapshot
⚡Score and Watts to Perf per Watt
| Benchmark Score | Power Draw | Perf per Watt | Reads As |
|---|---|---|---|
| 9000 | 6 W | 1500 | Very efficient |
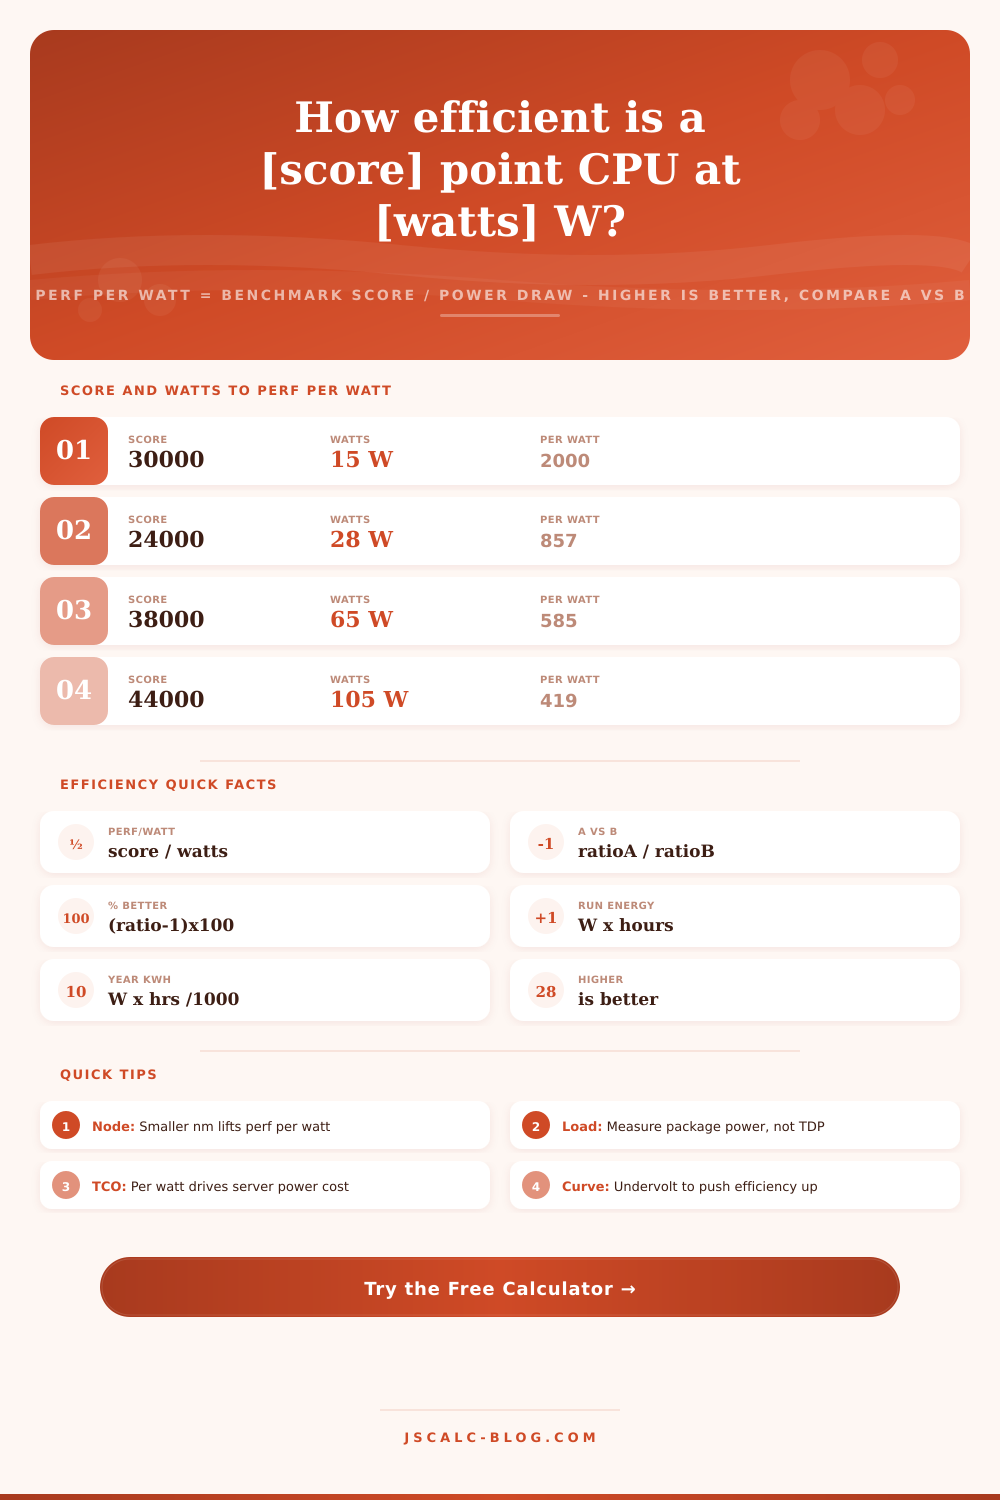
| 30000 | 15 W | 2000 | Peak mobile |
| 24000 | 28 W | 857 | Ultrabook |
| 38000 | 65 W | 585 | Mainstream desk |
| 44000 | 105 W | 419 | Gaming chip |
| 52000 | 170 W | 306 | Workstation |
| 61000 | 250 W | 244 | HEDT |
| 68000 | 280 W | 243 | Many-core server |
📊Efficiency Rating Bands
| Perf per Watt | Efficiency Band | Typical Class | What It Means |
|---|---|---|---|
| 1200 and up | Elite | Fanless mobile | Best battery and thermals |
| 700 to 1199 | Excellent | Thin and light | Great work per joule |
| 450 to 699 | Strong | 65W desktop | Balanced mainstream |
| 300 to 449 | Average | Gaming desktop | Perf favored over power |
| 200 to 299 | Power hungry | HEDT and server | Raw throughput focus |
| Below 200 | Inefficient | Overclocked | High watts per point |
🗃CPU Efficiency Comparison Grid
| CPU Class | Score | Watts | Perf/Watt | Node | Rank |
|---|---|---|---|---|---|
| Peak Mobile 15W | 30000 | 15 | 2000 | 4 nm | 1 |
| Embedded 6W | 9000 | 6 | 1500 | 5 nm | 2 |
| Ultrabook 28W | 24000 | 28 | 857 | 5 nm | 3 |
| Desktop 65W | 38000 | 65 | 585 | 5 nm | 4 |
| Gaming 105W | 44000 | 105 | 419 | 6 nm | 5 |
| Workstation 170W | 52000 | 170 | 306 | 7 nm | 6 |
| HEDT 250W | 61000 | 250 | 244 | 7 nm | 7 |
| Server 280W | 68000 | 280 | 243 | 5 nm | 8 |
| Old Node 95W | 21000 | 95 | 221 | 14 nm | 9 |
🔌Annual Energy by Power Draw
| Avg Power | 2000 h / yr | Cost at 0.16 | Context |
|---|---|---|---|
| 10 W | 20 kWh | 3.20 | Fanless mini PC |
| 28 W | 56 kWh | 8.96 | Laptop at load |
| 65 W | 130 kWh | 20.80 | Office desktop |
| 105 W | 210 kWh | 33.60 | Gaming desktop |
| 170 W | 340 kWh | 54.40 | Workstation |
| 280 W | 560 kWh | 89.60 | Rack server node |
⚙Formula Breakdown
💡Efficiency Insights
For example: if your question isn’t about which is the fastest processor, but rather “which will do the most computing given a watt of electricity” then the CPU performance per watt calculator is what’s for you. Here’s the rule: it’s an exact equation with two variables. Performance per watt = (benchmark score) / (power used). So a higher number are always better. It does more computing for every joule of energy.
All you do is feed the tool two chips’ wattages and scores and it’ll rate ’em both. Then it tells you which wins per watt. It also shows how much energy each one burns per run and across a whole year. Clock speed and core count sell processors, but efficiency is what decides battery life in a laptop. Servers runs in rooms full of servers drawing electricity; that’s dictated by efficiency, too.
What Is CPU Performance Per Watt?
One processor might use one hundred five watts while another uses twenty-eight, yet show identical scores in a benchmark. They’d appear identical on a spec sheet. In reality, one run quietly and cool for hours on a battery charge, while the other requires a larger power supply and a louder fan. Performance per watt puts all that into one number you can compare apples-to-apples different than another part that was never intended to be compared.
One division, and everything depends on it. Benchmark score divided by power in watts equals performance per watt. Twenty-four thousand points in a multi-core test drawn from a twenty-eight-watt chip is about eight hundred fifty-seven points per watt. Sixty-five watts to thirty-eight thousand is five hundred eighty-five. Higher are better. See the trick? Actualy, the chip with the lower raw score is also the more efficient one. And that’s exactly what measuring in watts per second instead of just seconds tries to do. It goes for those who don’t waste energy chasing the last few percent in raw speed.
So how do you directly compare two processors? You take each processor’s efficiency figure and divide one by the other. In our example, we get a ratio of approximately 1.465 (eight hundred fifty-seven divided by five hundred eighty-five). This tell us that chip A does 1.47 times the work per watt. So how do we translate that into a percentage? Simply subtract one from the result, then multiply by one hundred. Even though chip B posts larger benchmark number, chip A is actualy about forty-seven percent more efficient per watt. The calculator above handles this math for you so you are never left guessing which direction the ratio points.
Power times time equals energy. Efficiency ratings are relative but energy is absolute. To compare this with one of their benchmarks, let’s say I have a twenty-eight watt chip that finishes its work in ten minutes. That means it’s using roughly four point sixty seven watt-hours. Scale that up over a year and we’re doing math. The calculator averages power between idle and load based off how much time you spend at full load. It then multiplies that average power by the number of hours a year you’ll be running it to come up with kilowatt-hours. Multiply that by your electricity rate and there’s your annual cost to run. It converts a vague efficiency rating into dollars and cents.
Efficiency results are only as honest as the wattage you enter. While it’s easy enough to start with rated TDP, most of these chips pull significantly more than their TDP when run hard under a benchmark. Package power provide a more accurate answer. Plug in the power the processor pulled during the same load where it scored. Equally important is keeping the type of benchmark used for both processors the same. A Geekbench score isn’t equivalent to a Cinebench multi-core score. Apples to apples here.
Manufacturing node is the largest lever on performance per watt. Frequency and voltage scale dynamic power as F^2V. Efficiency leaps when a chip hits the same clocks but at lower voltage, which happens if you move from a five-nanometer process down to a fourteen. That’s what explains how a moddern mobile part without a fan can top two thousand points per watt while an older desktop chip in the same performance class chugs away at around two-hundred-twenty. Undervolting or capping the power limit allows you to ride the same curve on hardware you already own. Shave off the wattage and you often lose just a sliver of score while seeing a sharp increase in performance per watt.
That’s the tradeoff that data centers are making in order to shrink total cost of ownership. On the page, it’s all spelled out on the reference table. On servers and high-end desktops, see where power goes up and efficiency goes down. Use the presets and then immediately see the numbers change. Visit JSCalc-Blog.com for other calculators such as this one.
It’s not about finding the fastest chip, it’s about finding the smartest one. It is the one that will do the most work for every joule. That’s how you win on efficiency.