CPU Overclock Percentage Calculator
Enter your stock and overclocked clock speeds to get the exact clock percentage gain, then estimate real performance uplift with a workload scaling factor and model the power increase from higher Vcore using dynamic power that scales with voltage squared times frequency.
🎯Popular Overclock Presets
🖥Clock, Voltage and Power Inputs
Toggles the unit for both clock fields below.
How much real app performance tracks clock. 1 = perfect, 0.85 typical.
Your factory all-core clock before overclocking.
Your new stable all-core clock after overclocking.
Core voltage at the stock clock, often 1.15 to 1.30 V.
Core voltage needed to hold the overclock stable.
Rated power draw at stock, used to scale estimated OC watts.
Controls rounding on every percentage result.
🔢Formula Snapshot
📈Clock Gain Reference Table
| Stock Clock | OC Clock | MHz Gained | Clock Gain % |
|---|---|---|---|
| 3.0 GHz | 3.9 GHz | 900 MHz | +30.0% |
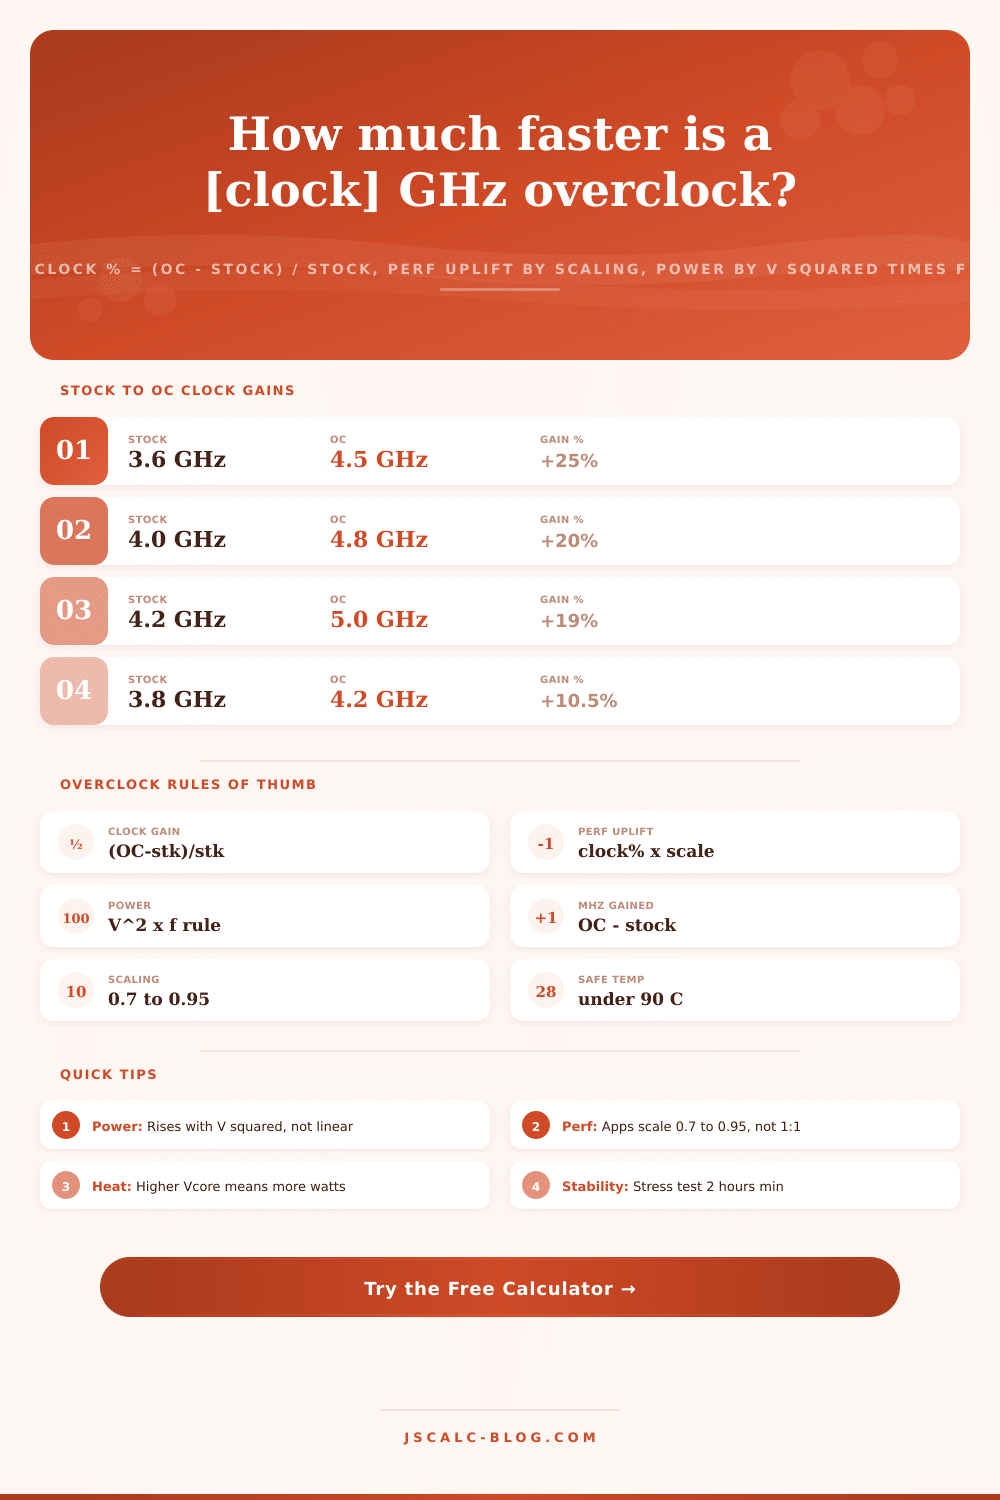
| 3.6 GHz | 4.5 GHz | 900 MHz | +25.0% |
| 3.8 GHz | 4.2 GHz | 400 MHz | +10.5% |
| 4.0 GHz | 4.8 GHz | 800 MHz | +20.0% |
| 4.2 GHz | 5.0 GHz | 800 MHz | +19.0% |
| 4.5 GHz | 5.1 GHz | 600 MHz | +13.3% |
| 4.7 GHz | 5.3 GHz | 600 MHz | +12.8% |
| 5.0 GHz | 5.5 GHz | 500 MHz | +10.0% |
🔋Voltage to Power Multiplier
| Stock Vcore | OC Vcore | Voltage Ratio | V Squared Factor |
|---|---|---|---|
| 1.20 V | 1.25 V | 1.042 | 1.085x |
| 1.25 V | 1.30 V | 1.040 | 1.082x |
| 1.25 V | 1.35 V | 1.080 | 1.166x |
| 1.30 V | 1.40 V | 1.077 | 1.160x |
| 1.30 V | 1.45 V | 1.115 | 1.244x |
| 1.25 V | 1.45 V | 1.160 | 1.346x |
| 1.20 V | 1.50 V | 1.250 | 1.563x |
🧮Performance Scaling by Workload
| Workload Type | Typical Scaling | 20% Clock Gain Gives | Notes |
|---|---|---|---|
| Synthetic bench | 0.95 | +19.0% | Cache and clock bound |
| Rendering (Cinebench) | 0.90 | +18.0% | Scales well with clock |
| Code compile | 0.85 | +17.0% | Mixed memory bound |
| Gaming (CPU limited) | 0.75 | +15.0% | Depends on the engine |
| Gaming (GPU limited) | 0.20 | +4.0% | GPU is the bottleneck |
| Office and web | 0.40 | +8.0% | Bursty, rarely maxed |
🗄Stock vs OC Comparison Grid
| Stock Clock | OC Clock | Clock Gain % | Perf Gain % | Power Delta % | MHz Gained |
|---|---|---|---|---|---|
| 3.6 GHz | 4.5 GHz | +25.0% | +21.3% | +35.0% | 900 MHz |
| 4.0 GHz | 4.8 GHz | +20.0% | +17.0% | +39.9% | 800 MHz |
| 4.0 GHz | 5.1 GHz | +27.5% | +23.4% | +58.2% | 1100 MHz |
| 4.2 GHz | 5.0 GHz | +19.0% | +16.2% | +32.5% | 800 MHz |
| 4.5 GHz | 5.1 GHz | +13.3% | +11.3% | +22.1% | 600 MHz |
| 5.0 GHz | 5.5 GHz | +10.0% | +8.5% | +18.5% | 500 MHz |
| 3.0 GHz | 3.9 GHz | +30.0% | +25.5% | +41.4% | 900 MHz |
| 4.7 GHz | 5.3 GHz | +12.8% | +10.9% | +21.6% | 600 MHz |
⚙Formula Breakdown
💡Overclocking Reality Checks
How much does your CPU over-clock realy get you? Enter your clock speeds (stock & OC), voltage pair, and workload scaling factor to find out. You will get four numbers that show if the extra speed is worth the extra power. It eliminates the marketing hype and gets down to some arithmetic: What’s the percentage gain in speed, how much more realistic performance do you actualy get, and what will the increase in power and heat be?
This is where I put the percentage of increase from the stock clock. You take the overclocked clock minus the stock clock, divide that by the stock clock and multiply that result by 100. So if you have a 4.0 GHz chip and bump it up to 4.8 GHz, you get a 20 percent increase. But if you start with a 5.0 GHz chip and bump it up by 800 MHz, you only gets a 16 percent increase. That’s because your bottom number in the second equation is larger then in the first. It’s why raw megahertz can trick you and lower clocked parts will typicaly display higher percentages.
Is Overclocking Worth It?
But clock speed isn’t directly proportional to performance. Doubling the clock speed doesn’t always result in doubling the performance on real-world tasks. It’s also hindered by other system components, such as graphics card, storage, cache, and memory. To properly account for this, you introduce a workload scaling factor somewhere between zero and one. A game that’s heavily bound by the graphics card could have a factor of 0.20 (or lower), whereas a synthetic benchmark would be closer to 0.95. Multiply the clock gain by this factor, and you’ve got an approximation of the real-world performance uplift. For example, if you doubled the clock speed but the factor was only 0.85 then the true boost would only be approximately 17 percent, which is far more helpful than just the straight clock value.
There’s no doubt that overclocking burns through a lot more power. More specifically, dynamic power depends on frequency, voltage squared, and capacitance. In other words, a modest increase in clock speed will cost far less power than same-size bump in voltage. Our calculator models this with the formula (voltage ratio)^2 * (clock ratio, 1).
A 40% jump in performance is expensive. Raising your clock from 4.0 to 4.8 GHz while lifting the voltage from 1.25 to 1.35 volts result in roughly a 40% jump in power draw. Not a great deal for just 20 percent speed. It also means heat goes up much faster without proportionally higher performance. To see what this translates into in terms of watts, the tool scales your stock TDP by the modeled power delta. It will scale your planned power change against your rated stock TDP. So if you have a 125-watt stock-draw chip and your power go up by 40 percent, the estimated draw is about 175 watts. That’s an additional 50 watts that has to be converted to heat, and removed by your cooler. And that’s why aggressive overclocks get so hot.
There are also some other assumptions here. For example, we assume that switching capacitance does not change with voltage. This is a reasonable assumption within a modest voltage range on one chip.
There are four cards for every calculation. There is the performance increase card which takes into account your scaling factor on top of pure frequency percentage. Next there’s the power increase card which takes the voltage-squared-times-frequency formula and gives you wattage estimate alongside the stock wattage. Then we have the frequency gained card which presents the raw MHz gain with automatic conversion from both megahertz and gigahertz. Finally below the cards we have a complete breakdown of all values used in the calculation. You can follow along line by line as each number is derived.
Common overclocking attempts are covered by preset buttons. The clock jumps is named 3.6 to 4.5GHz and 4.0 to 4.8GHz. Intensity presets range from an extremely mild 5 percent nudge to more extreme 25 percent targets. The undervolt preset shows how some chips can increase their frequency while using less power when you drop the voltage. These fill the form instantly and give you a baseline you can tweak to suit your own chip.
The live calculator is supported by reference tables. There’s a clock gain table that matches common speeds with their percentage gain and megahertz change. There’s also a voltage-to-power multiplier table to show how fast power increases with voltage increase. There’s a performance scaling table matching typical factors of various workloads, ranging from gaming to synthetic benchmarks. And then there’s a comparison grid, which matches the megahertz gained, power delta, clock gain and performance gain across sample chips so you can view the entire tradeoff in one glance.
Overclocking exposes the law of diminishing returns. The first part, using stock or slightly increased voltage, is almost free. That final couple of hundred megahertz might necessitate a voltage bump that’s greater than its value in performance. When your card hits that inflection point where power go up faster than performance, you’re at the inefficient end of things. Add to this the knowledge gained during a two-hour-plus minimum stress test and the fact that temperatures stay under 90 degrees Celsius and you should of be able to find a number that’s both sensible and sweet. This prevents you from running down a rabbit hole chasing that next benchmark screenshot while spending sixty more watts for just four percent additional frames.