CPU Core Utilization Calculator
Measure how hard your processor is really working. Enter total and active cores with their load, or busy time against total time, and see overall utilization, average per-core load, idle headroom, and core skew so a single pegged thread never hides behind a low system average.
📊Choose a Measurement Mode
🎯Real Workload Presets
📝Utilization Inputs
All schedulable cores or threads on the CPU.
Cores carrying work; must not exceed total.
Mean utilization across the busy cores only.
The most saturated core, used for skew.
The least loaded busy core, used for skew.
Non-idle CPU time inside the sample window.
Full measurement window, busy plus idle.
Idle margin you want free for spikes.
Affinity-locked threads, informational only.
Controls rounding on every result card.
🔢Formula Snapshot
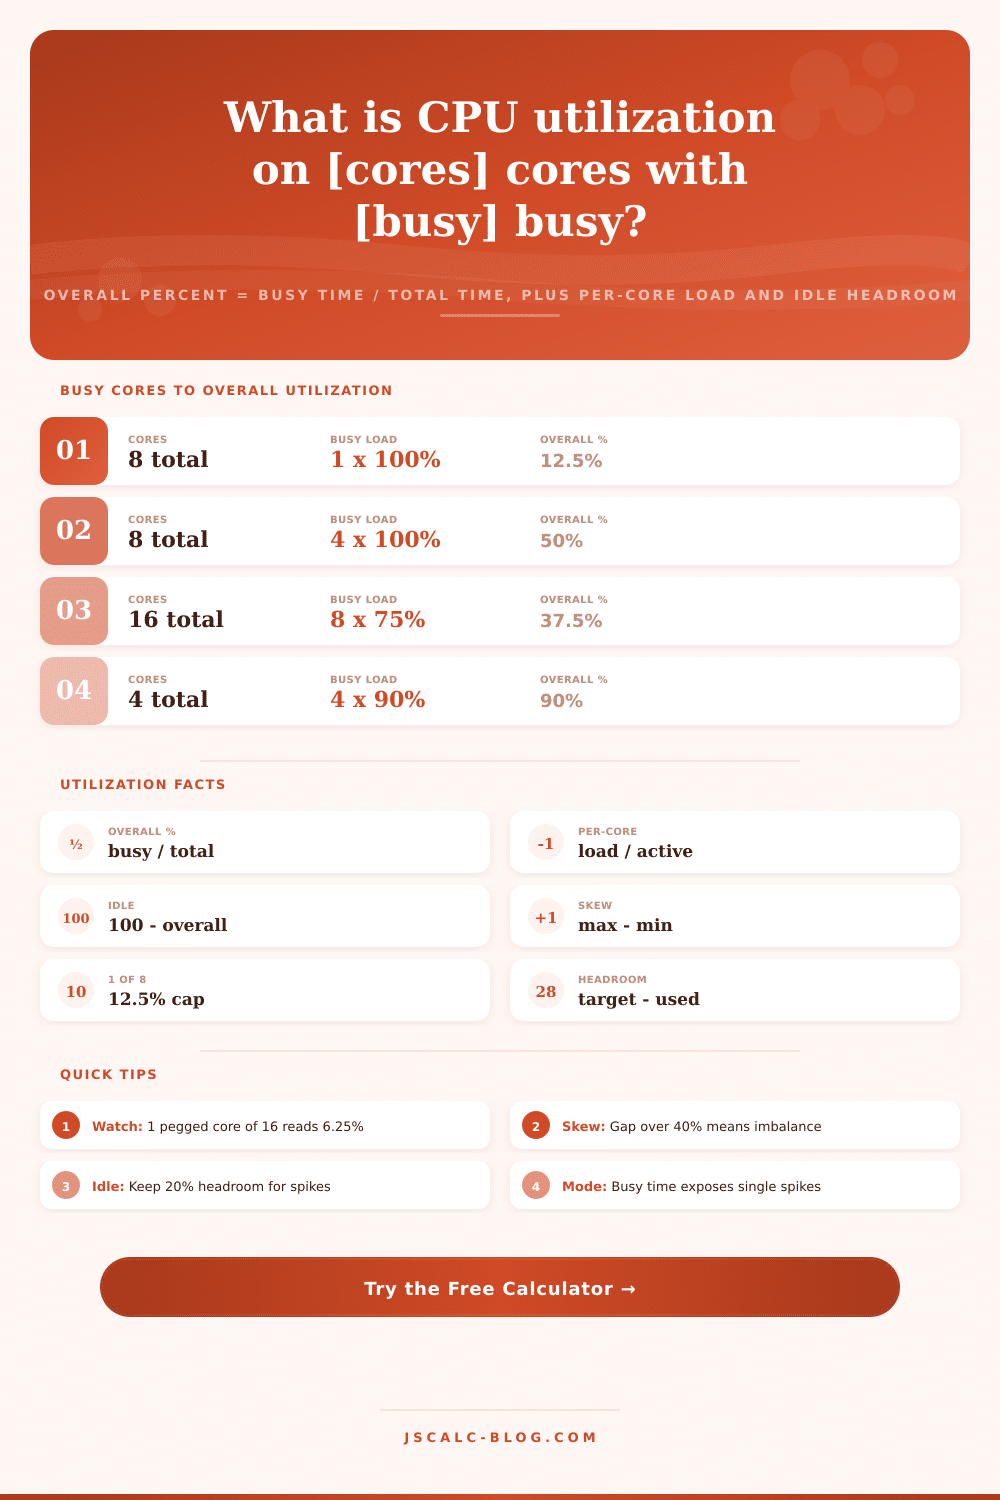
📈Busy Cores to Overall Utilization
| Total Cores | Busy Cores | Per-Core Load | Overall U = busy x load / total |
|---|---|---|---|
| 8 | 1 | 100% | 12.5% |
| 8 | 4 | 100% | 50% |
| 8 | 8 | 100% | 100% |
| 12 | 1 | 100% | 8.33% |
| 16 | 8 | 75% | 37.5% |
| 16 | 16 | 50% | 50% |
| 24 | 12 | 80% | 40% |
| 32 | 16 | 50% | 25% |
⏱Busy Time to Utilization Percent
| Busy Time | Total Window | Idle Time | Utilization % | Reads As |
|---|---|---|---|---|
| 50 ms | 1000 ms | 950 ms | 5% | Mostly idle |
| 250 ms | 1000 ms | 750 ms | 25% | Light load |
| 500 ms | 1000 ms | 500 ms | 50% | Half busy |
| 720 ms | 1000 ms | 280 ms | 72% | Heavy load |
| 180 ms | 250 ms | 70 ms | 72% | Heavy load |
| 900 ms | 1000 ms | 100 ms | 90% | Near limit |
| 1000 ms | 1000 ms | 0 ms | 100% | Saturated |
🗄Scenario Health Comparison Grid
| Scenario | Cores Busy | Overall % | Per-Core % | Headroom | Skew | Status |
|---|---|---|---|---|---|---|
| Idle desktop | 1 of 8 | 5% | 40% | 95% | Low | Healthy |
| Single-thread | 1 of 12 | 8.33% | 100% | 91.7% | High | Warn |
| Gaming | 6 of 8 | 60% | 80% | 40% | Med | Healthy |
| Web server | 12 of 24 | 40% | 80% | 60% | Low | Healthy |
| Render farm | 16 of 16 | 100% | 100% | 0% | None | Critical |
| Skewed batch | 4 of 32 | 12.5% | 100% | 87.5% | High | Warn |
| Balanced load | 16 of 16 | 70% | 70% | 30% | None | Healthy |
| Peak spike | 8 of 8 | 95% | 95% | 5% | Low | Critical |
🧭Utilization Bands and Meaning
| Overall Band | Label | Idle Headroom | Recommended Action |
|---|---|---|---|
| 0 to 25% | Under-used | 75%+ | Consolidate or scale down |
| 25 to 60% | Comfortable | 40 to 75% | Steady state, no action |
| 60 to 80% | Busy | 20 to 40% | Monitor peaks closely |
| 80 to 90% | Stretched | 10 to 20% | Plan more capacity |
| 90 to 100% | Saturated | Under 10% | Add cores or shed load |
| Any with skew > 40 | Imbalanced | Varies | Rebalance threads |
⚙Formula Breakdown
💡Utilization Reading Tips
A common metric seen in task managers is just a single CPU usage percentage. However, this hide some crucial information. 12% across all cores sounds fine until one core is running at 100%, stalling out your application. Conversely, 70% across all cores could very well indicate a healthy, balanced server. This is where raw average doesn’t provide the complete picture. By breaking down total use into both per-core and overall load, calculator displays true state of the server.
At its core, CPU use is all about time. How much is actualy being used to do work versus idling? OSes report on this by dividing number of busy ticks (time spent working) by total number of ticks over some period of time. In other words, if your processor spends 720ms out of every 1,000ms in an active state, then it’s 72 percent used; the rest is idle, or headroom when things spike suddenley. That’s the under-the-hood time-slice view of hardware reporting its current status.
Why CPU Percentage Is Not Enough
That number is confusing when there’s more than one core. We’re showing total use because it shows how fully used the whole chip is, but we can also ask about per-core load, which show how much work each active core are doing. If they differ wildly, then what you’ve got is a workload that doesn’t make good use of all your cores. We compute both numbers in parallel so you can compare them to see if it’s the system or something else that’s holding things back.
Take as an example what we call the single-thread trap; an all-too-common mistake for engineers. You start up a program and it is slow as molasses, yet your system monitor tell you the CPU is almost totally unused. Maybe there’s one core at full bore, 100% pegged, on an 8-core system. So total usage is one out of eight cores; that’s only 12.5% right? And if it’s on a 16-core CPU, that single pegged core appear as only 6.25%? All that happens is that a single thread are utterly saturated, completely thrashing and blocking your work, yet the system appear practically comatose. That’s the thing most folks don’t see. This means the idle capacity, which is just 100…
Overall utilization, is most important for stability. With an overall utilization of 95%, there’s just 5% headroom before the tiniest burst of extra work push it into saturation and latency shoots up. In general, the sweet spot for responsiveness is usually around 60 to 70% use at steady state, giving a nice cushion during peaks while not wasting the expensive hardware you paid for. You can also specify a target headroom and we’ll report how much your actual margin are from this goal.
The way a system distributes that workload will make it appear differently even though both systems may have the same overall utilization level. That imbalance, the difference between your busiest core and your least busy core, is called load skew. If load skew is close to zero then your threads is being scheduled well. Above 40 points indicate trouble: Some of your cores are working hard; other cores is coasting. You’re wasting the capacity you already paid for. If the skew is high, don’t fix it by buying more hardware; instead, review your processor affinity settings or rebalance your threads.
There are two methods of feeding it information to match how you monitor things. In aggregate mode, it take the percentage of the load and number of cores in use. This is basically total active workload divided by total number of cores. That’s how utilization is calculated as an overall number. The other is time-slice mode, which feeds in busy milliseconds vs. Total milliseconds and calculates straight away, matching what sampling profilers report out. You get the same results cards. Both formulas are laid out so you can check all the values that has been plugged in and check the math yourself.
The ten presets range from an idle desktop with 5%, to a stubborn single-threaded workload on a 12-core machine to a game pegging six out of its eight cores. The point is that same hardware can do wildly different things. The reference tables link usage bands with suggested action: consolidate under-utilized machines when below 25%; add cores when above 90%. Either tune your render node or right-size your cloud instance; either way, you get both halves of the picture in seconds. No more guesswork about why your app’s slow, now you know just what core is holding it back.