Cache Hit Ratio Calculator
Measure cache performance from real access counts. Enter cache hits and misses, or a total request count with a known hit ratio, then add hit time and miss penalty to get hit rate, miss rate, average memory access time (AMAT), and the effective speedup a cache delivers over always going to the slow backing store.
🎯Choose an Input Mode
⚡Real Cache Layer Presets
📝Cache Performance Inputs
Requests served directly from this cache layer.
Requests that had to fall through to slower storage.
All lookups against this cache in the measured window.
Hit percentage from monitoring; hits = total x ratio.
Selecting a layer fills hit time and miss penalty below.
Applies to both hit time and miss penalty.
Time to serve a hit from this layer, e.g. L1 near 1.
Extra time to fetch on a miss from the next level.
Controls rounding on ratios and AMAT cards.
🔢Formula Snapshot
📋Hit and Miss Counts to Ratio
| Cache Hits | Cache Misses | Total | Hit Ratio | Miss Ratio |
|---|---|---|---|---|
| 9,900 | 100 | 10,000 | 99.00% | 1.00% |
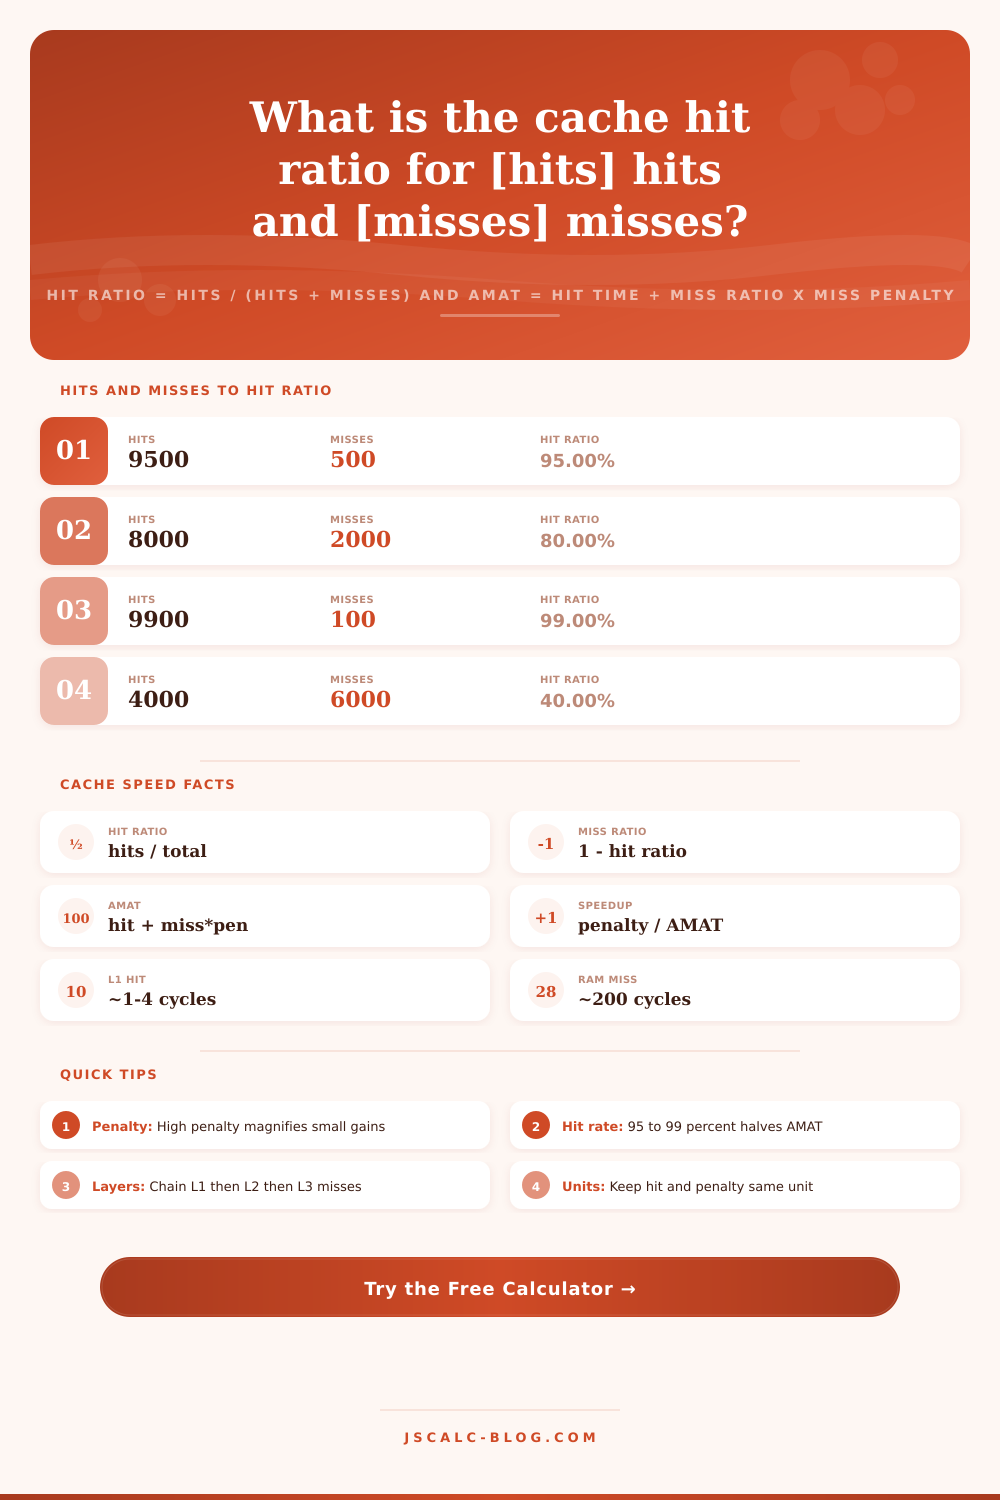
| 9,500 | 500 | 10,000 | 95.00% | 5.00% |
| 9,000 | 1,000 | 10,000 | 90.00% | 10.00% |
| 8,500 | 1,500 | 10,000 | 85.00% | 15.00% |
| 8,000 | 2,000 | 10,000 | 80.00% | 20.00% |
| 7,000 | 3,000 | 10,000 | 70.00% | 30.00% |
| 6,000 | 4,000 | 10,000 | 60.00% | 40.00% |
| 4,000 | 6,000 | 10,000 | 40.00% | 60.00% |
🗄Typical Access Times by Cache Layer
| Cache Layer | Hit Time | Miss Goes To | Miss Penalty | Relative Speed |
|---|---|---|---|---|
| L1 CPU cache | ~1 ns | L2 cache | ~4 ns | Fastest |
| L2 CPU cache | ~4 ns | L3 cache | ~14 ns | Very fast |
| L3 CPU cache | ~14 ns | Main memory | ~100 ns | Fast |
| Main memory | ~100 ns | SSD / disk | ~100,000 ns | Moderate |
| Redis / app cache | ~0.2 ms | Database | ~10 ms | Network hop |
| CDN edge cache | ~20 ms | Origin server | ~200 ms | Geo edge |
| Browser cache | ~1 ms | Network fetch | ~150 ms | Local disk |
📊Cache Performance Comparison Grid
| Scenario | Hit Rate | Hit Time | Miss Penalty | Miss Rate | AMAT | Speedup |
|---|---|---|---|---|---|---|
| L1 95% Hit | 95% | 1 ns | 200 ns | 5% | 11.00 ns | 18.18x |
| L2 80% Hit | 80% | 4 ns | 200 ns | 20% | 44.00 ns | 4.55x |
| L3 70% Hit | 70% | 14 ns | 200 ns | 30% | 74.00 ns | 2.70x |
| Redis 99% Hit | 99% | 0.2 ms | 10 ms | 1% | 0.30 ms | 33.33x |
| CDN 90% Hit | 90% | 20 ms | 200 ms | 10% | 40.00 ms | 5.00x |
| Warm CDN 99% Hit | 99% | 20 ms | 200 ms | 1% | 22.00 ms | 9.09x |
| DB Buffer 85% | 85% | 0.1 ms | 10 ms | 15% | 1.60 ms | 6.25x |
| Cold Cache 40% Hit | 40% | 1 ns | 200 ns | 60% | 121.00 ns | 1.65x |
| Browser 97% Hit | 97% | 1 ms | 150 ms | 3% | 5.50 ms | 27.27x |
| TLB 99.9% Hit | 99.9% | 1 ns | 100 ns | 0.1% | 1.10 ns | 90.91x |
📉How Hit Rate Bends AMAT (hit 1, penalty 200)
| Hit Rate | Miss Rate | AMAT (ns) | Speedup |
|---|---|---|---|
| 50.00% | 50.00% | 101.00 ns | 1.98x |
| 80.00% | 20.00% | 41.00 ns | 4.88x |
| 90.00% | 10.00% | 21.00 ns | 9.52x |
| 95.00% | 5.00% | 11.00 ns | 18.18x |
| 99.00% | 1.00% | 3.00 ns | 66.67x |
| 99.90% | 0.10% | 1.20 ns | 166.67x |
⚙Formula Breakdown
💡Cache Tuning Tips
Somehow your system is slowing down, but there’s no clear cause. Everything else seems fine: the network is steady, the database looks OK. Users see it though; requests are dragging. Memory hierarchy leaks is usually the culprit.
Caches service request fast. They rarely force the dreaded slow trip back to backing store. This tool takes raw access counts and converts them into three numbers describing the cache performance. These numbers are average memory access time, the miss ratio, and the hit ratio. It reports the effective speedup that cache provides as well.
How to Measure Cache Performance
The hit ratio is hits divided by (hits + misses). You can think of this as the fraction of lookups that a cache serve without going anywhere else. For example, if your L1 CPU cache meets 9,500 out of 10,000 loads, then it has a 95% hit ratio. The miss ratio is one minus the hit ratio. Either you hit, or you miss. Each request is either one or the other. Because it’s symmetric, one number capture everything.
Hit ratio carries across from L1 cache to CDN edge node to Redis instance. It’s a measure of quality that doesn’t depend on how fast underlying storage is. There are two forms of real-world measurements. Both work in calculator. One is entering observations of cache misses vs. Hits. The calculator sums these up and divides them to get the cache hit rate.
The other is entering your total request count along with your cache hit ratio from some dashboard. Using some simple multiplication, the tool uncovers underlying count values. This is important because different sources will express things different than. If I run an “INFO” command against a Redis instance, it returns the number of keyspace hits/misses. Many CDN dashboards show me the cache hit percent over some time window.
Once you enter your actual metrics into the calculator, it does math for you. It saves you the guesswork on conversions. That’s nice; it feels good to be getting a lot of hits. But the true measure of latency is the average memory access time, AMAT. That measures the cost of a miss in relation to how often it happen.
This is the simple math: AMAT = hit time + (miss ratio * miss penalty) Hit time is the cost of reaching into your cache on each access. Miss penalty: When you didn’t find the data in the cache, how long did it take to fetch the next level down? That’s the miss penalty.
So here’s a 95% hit ratio for an L1 cache. Hit time was 1 nanosecond and the miss penalty was 200 nanoseconds. How’d it turn out for average memory access time, aka AMAT? It turns out to be 11 nanoseconds. The cache managed to reduce the average from what could of been 200 nanoseconds down to 11.
Now people commonly get this wrong. They obsess about their hit percentage, but forget cost of a miss. The tool makes this concrete by reporting the effective speedup, which is the miss penalty divided by AMAT. For the example above, that’s about 18 times faster on average than if we’d always paid the full fetch cost.
As hit ratio increases towards 100%, so does speedup! Hit ratio shrinks the miss ratio term, which shrinks towards zero. AMAT collapses toward bare hit time. A cache is not linear. The last few percentage points of hit ratio are worth vastly more than first. That is the single most useful intuition the tool give me.
AMAT equals hit time plus miss ratio times penalty. So making your hits count more makes the effect of raising your hit ratio even greater. Raise the hit ratio by four percentage points from 95% to 99%, and you drop AMAT from 11 to 3 nanoseconds if there’s a 200 nanosecond penalty for missing. Just four additional points means a 3.7 times reduction in AMAT.
If the miss penalty is fetching an origin from a CDN 200 milliseconds away, then a tiny increase in hit ratio shrinks the penalty term by a dramatic amount. On a thousand requests, it could shave off seconds. Tune where penalties matter most. Getting a small improvement in hit ratio on a slow backing store wins out over getting a big improvement on a fast one.
They’re real: Real systems has multiple layers of cache. The AMAT formula naturaly flows into a neat nest to describe their behavior. To compute two-levels, compute the inner one first. Use its AMAT as the miss penalty for the outer level. Use it as the miss penalty for the outer level. And that is why a good L2 can soften impact of a bad L1 so much. Designers do not optimize each layer independently. They optimize the entire hierarchy.
That’s what the reference table on the page spells out for ten plausible scenarios. 9% TLB. So look at it yourself by eye. Pick a starting point. Replace our misses/hits with yours. See how the math exactly describes your own cache’s position. It is not merely to measure performance but to quantify the price of quietness among your memory layers.