Blood pH Calculator
Estimate arterial blood pH from bicarbonate (HCO3–) and pCO2 using the Henderson-Hasselbalch equation, then classify the acid-base picture as respiratory or metabolic acidosis or alkalosis. Educational only.
🩸Clinical ABG Presets
📝Acid-Base Inputs
Rearranges Henderson-Hasselbalch to solve the missing value.
Normal arterial range 22 to 26 mEq/L (mmol/L).
Normal arterial range 35 to 45 mmHg.
Used only when solving for HCO3 or pCO2.
Standard 0.03 mmol/L per mmHg at 37°C.
Standard 6.1 for the bicarbonate buffer.
For HCO3 the two units are numerically equal.
🔢Henderson-Hasselbalch Snapshot
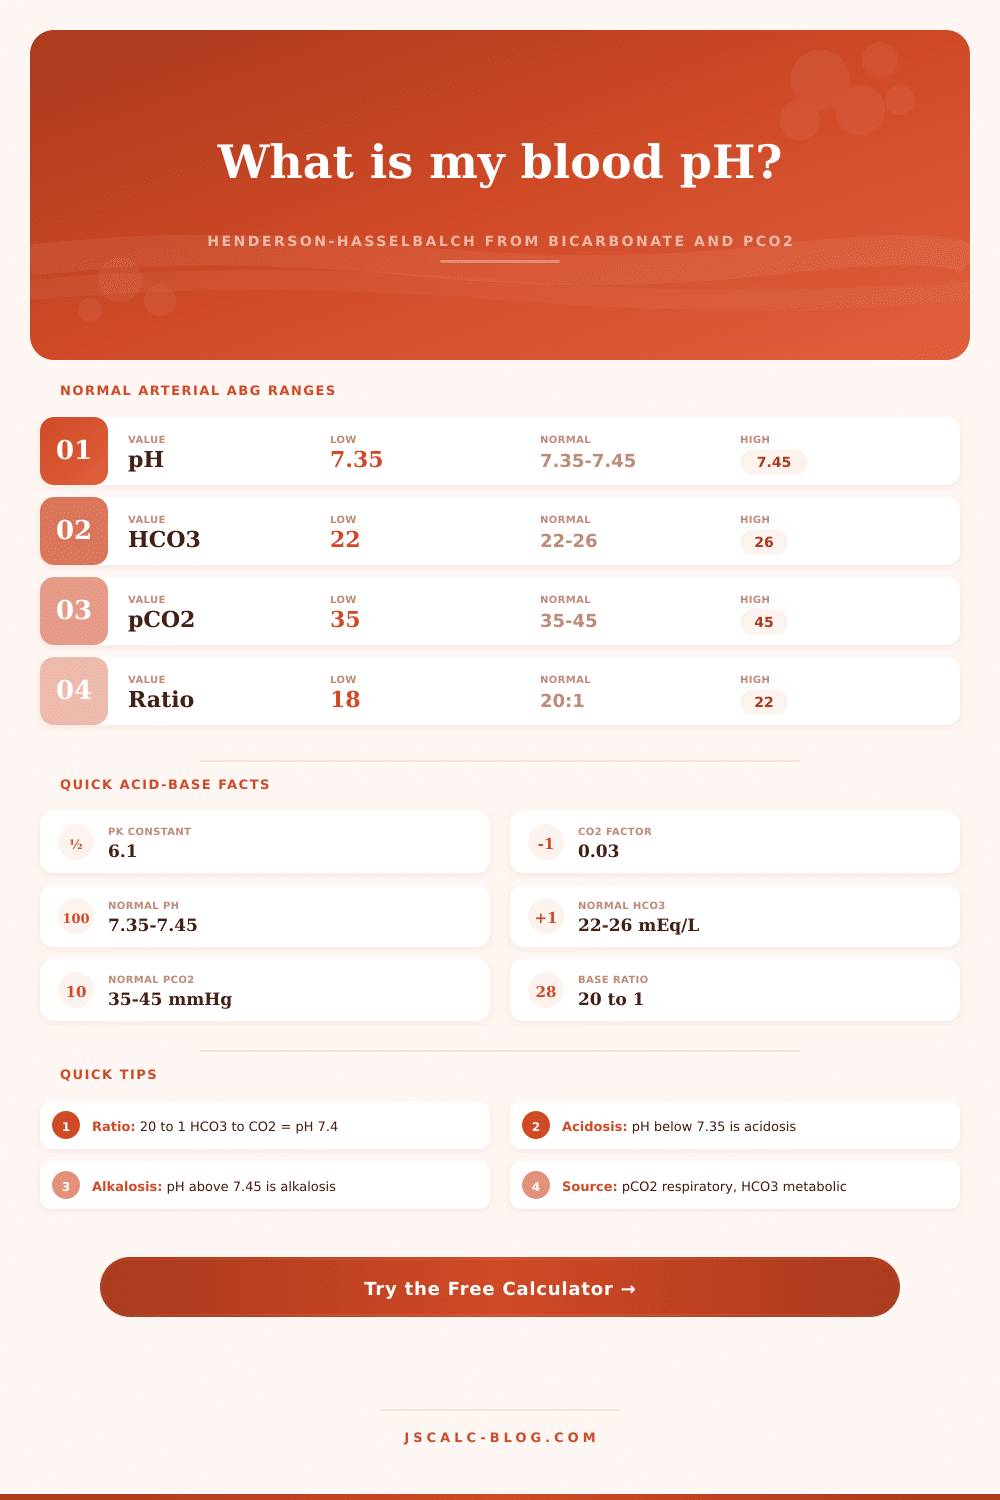
📋Normal Arterial ABG Ranges
| Parameter | Low Limit | Normal Range | High Limit | Unit |
|---|---|---|---|---|
| Blood pH | < 7.35 | 7.35 to 7.45 | > 7.45 | pH units |
| Bicarbonate HCO3– | < 22 | 22 to 26 | > 26 | mEq/L |
| pCO2 | < 35 | 35 to 45 | > 45 | mmHg |
| Dissolved CO2 (0.03 × pCO2) | < 1.05 | 1.05 to 1.35 | > 1.35 | mmol/L |
| HCO3 : dissolved CO2 ratio | < 18 | ~ 20 : 1 | > 22 | ratio |
🧪Acid-Base Disorder Patterns
| Disorder | pH | Primary Change | HCO3 | pCO2 | Expected Compensation |
|---|---|---|---|---|---|
| Respiratory acidosis | Low | pCO2 high | Normal / high | > 45 | Kidney raises HCO3 |
| Respiratory alkalosis | High | pCO2 low | Normal / low | < 35 | Kidney drops HCO3 |
| Metabolic acidosis | Low | HCO3 low | < 22 | Normal / low | Lungs blow off CO2 |
| Metabolic alkalosis | High | HCO3 high | > 26 | Normal / high | Lungs retain CO2 |
| Mixed disorder | Variable | Both shift | Abnormal | Abnormal | No single fix |
🗂HCO3 & pCO2 vs pH Comparison Grid
| Scenario | HCO3 (mEq/L) | pCO2 (mmHg) | Calc pH | Status | Likely Disorder |
|---|---|---|---|---|---|
| Normal balance | 24 | 40 | 7.40 | Normal | Balanced acid-base |
| CO2 retention | 26 | 60 | 7.26 | Acidosis | Respiratory acidosis |
| Low bicarbonate | 15 | 38 | 7.22 | Acidosis | Metabolic acidosis |
| Fast breathing | 22 | 28 | 7.52 | Alkalosis | Respiratory alkalosis |
| High bicarbonate | 34 | 45 | 7.50 | Alkalosis | Metabolic alkalosis |
| COPD retention | 34 | 70 | 7.31 | Acidosis | Chronic respiratory |
| DKA low HCO3 | 10 | 22 | 7.28 | Acidosis | Metabolic + resp comp |
| Panic hyperventilation | 20 | 25 | 7.53 | Alkalosis | Respiratory alkalosis |
| Compensated chronic | 34 | 60 | 7.38 | Normal | Compensated resp acidosis |
🩺pH Interpretation Bands
| pH Band | Label | Interpretation | Typical Note |
|---|---|---|---|
| < 6.80 | Critical low | Severe acidemia | Life threatening range |
| 6.80 to 7.34 | Acidosis | Below normal | Acid excess or base loss |
| 7.35 to 7.45 | Normal | Balanced | Healthy arterial pH |
| 7.46 to 7.60 | Alkalosis | Above normal | Base excess or CO2 loss |
| > 7.60 | Critical high | Severe alkalemia | Life threatening range |
⚙Full Henderson-Hasselbalch Breakdown
💡Practical Acid-Base Tips
Your body maintains a very tight range for pH of your blood. In fact, it’s 7.35-7.45. No matter what you eat, breathe, or do, that range holds. That tiny change in decimals is the difference between life and a sudden medical emergency.
When your kidneys or your lungs fails, how does the rest of your body know what to do? The secret here is a simple ratio: On the left-hand side, you have bicarbonate (a base) coming out off your metabolism. On the right-hand side, you have carbon dioxide (an acid) coming out of your breath. These two forces fight each other and their relationship is described by Henderson-Hasselbalch equation.
How Your Body Keeps pH Balanced
You plug in your variables into the calculator and it does all the math for you. No more dealing with logarithms and you can concentrate on interpreting the numbers for patient’s physiology.
PH is a sign of a balance between metabolic and respiratory systems. It’s a single number that shows the tension between these two systems, which appear on an arterial blood gas as two separate organs working to balance each other.
When your lungs aren’t clearing out enough CO2, it will begin to make your blood more acidic. Maybe you have sleep apnea or asthma. In response, the kidney cells detects the increased acidity, and start hanging onto bicarbonate to try to balance the decline. It takes time. But eventually, it do work. Because really, the body doesn’t let one system go completely tits up without giving the other a shot at helping.
To test out any of those situations, you can play with the input values yourself. For example, if we depress the bicarbonate and leave the carbon dioxide at a normal level, then what happens? It drops your pH down into acidic range, which is consistent with conditions such as severe diarrhea or diabetic ketoacidosis where you lose more base then you can replace.
On the other hand, if you spike the carbon dioxide pressure, that’s consistent with some sort of respiratory distress. You see the calculator reflect how fast this balance will shift when one of them move independently.
According to the reference table, normal bicarb is roughly 24 milliequivalents per liter. CO2 is close to 40 millimeters of mercury. This establishes a certain ratio. A 20-to-1 base/acid ratio. Altering this by even a little bit shifts pH significantly. It is a small thing, but very important when seconds count in critical care.
It gets more complicated from there with compensation. For example, chronic diseases such as COPD may present with a very high level of CO2 which in turn would resulted in severe acidosis. But over time, these patients’ kidneys compensates by increasing their level of bicarbonate until the pH is again near normal. Plug in elevated values for both variables and the calculator shows it.
You’ll note that even though both variables are unusually high, the pH is almost normal. That’s why context is so important here. A normal pH doesn’t necessarily equate to a healthy patient if both systems is compensating at maximum.
These tools have limitations. They assume normal body temp and fail to account for things like plasma proteins, hemoglobin etc. These also buffer pH changes. They provide a snapshot of a person’s chemistry; they do not diagnose the cause. To make a real clinical judgment, you will need to look at the patient’s history, electrolyte panels, and oxygen levels.
It is not about how much it drifted, but why it drifted. It’s not so much about memorization, but more about seeing the pattern of compensation that will help you understand acid-base balance.
Whether you’re a clinician who wants to review patient trends or a student preparing for an exam, it doesn’t matter. Both of you has one thing in mind: Which organ system is leading the charge? And which one is following along to maintain homeostasis?
The body never stops its efforts to balance what we breathe out with what we carry inside our blood, seeking that neutral center point at all times. You should of noticed how naturaly fast things change. The moddern ways of looking at this makes it easier to recieve help.