Battery State of Charge From Voltage Calculator
Estimate state of charge from a resting open-circuit voltage. Pick your chemistry, read a single cell or a whole pack, and the tool interpolates SoC percent from real per-chemistry discharge curves, then reports remaining capacity, per-cell voltage and a Full to Critical status label.
⚡Measurement Mode
🔌Real Battery Presets
🔊Reading Inputs
Each chemistry has its own resting voltage curve.
Open-circuit volts with no load, after resting.
Pack volts are divided by S to get per-cell.
Used to estimate remaining amp-hours.
Note only: cold cells read slightly lower.
Controls rounding on the SoC and capacity cards.
Important: voltage must be measured at rest with no charger or load connected. A battery under load reads lower than its true open-circuit voltage, and a battery just off the charger reads higher. Let it settle 1 to 2 hours before reading for the most reliable state of charge estimate.
🔢Method Snapshot
📊SoC vs Resting Voltage Comparison Grid
| State of Charge | Li-ion / cell | LiFePO4 / cell | Lead-acid 12V | NiMH / cell |
|---|---|---|---|---|
| 100% | 4.20 V | 3.40 V | 12.70 V | 1.40 V |
| 90% | 4.06 V | 3.35 V | 12.58 V | 1.38 V |
| 80% | 3.98 V | 3.32 V | 12.46 V | 1.36 V |
| 70% | 3.92 V | 3.29 V | 12.34 V | 1.34 V |
| 50% | 3.70 V | 3.20 V | 12.20 V | 1.28 V |
| 30% | 3.60 V | 3.13 V | 12.06 V | 1.22 V |
| 20% | 3.50 V | 3.08 V | 12.00 V | 1.18 V |
| 10% | 3.40 V | 3.00 V | 11.90 V | 1.12 V |
| 0% | 3.00 V | 2.50 V | 11.80 V | 1.00 V |
🔋Nominal and Cutoff Voltages by Chemistry
| Chemistry | Nominal / cell | Full / cell | Empty cutoff |
|---|---|---|---|
| Li-ion NMC | 3.70 V | 4.20 V | 3.00 V |
| LiFePO4 | 3.20 V | 3.65 V rest 3.40 | 2.50 V |
| Lead-acid (cell) | 2.10 V | 2.12 V | 1.97 V |
| Lead-acid 12V block | 12.60 V | 12.70 V | 11.80 V |
| NiMH | 1.20 V | 1.40 V | 1.00 V |
| NiCd | 1.20 V | 1.35 V | 1.00 V |
🔌Pack Voltage to Per-Cell Examples
| Config | Chemistry | Pack Voltage | Per-Cell | Approx SoC |
|---|---|---|---|---|
| 3S | Li-ion | 11.40 V | 3.80 V | 60% |
| 7S | Li-ion | 25.90 V | 3.70 V | 50% |
| 10S | Li-ion | 42.00 V | 4.20 V | 100% |
| 4S | LiFePO4 | 13.20 V | 3.30 V | 70% |
| 8S | LiFePO4 | 25.60 V | 3.20 V | 50% |
| 16S | LiFePO4 | 51.20 V | 3.20 V | 50% |
| 2 blocks | Lead-acid | 24.80 V | 12.40 V | 75% |
🌡Temperature and Load Effect Notes
| Condition | Effect on Reading | What to Do | Typical Shift |
|---|---|---|---|
| Under load | Reads lower | Disconnect draw | 0.1-0.5 V low |
| Just charged | Reads higher | Rest 1-2 hours | 0.05-0.2 V high |
| Cold cell | Reads lower | Warm to 20 C | 0.02-0.1 V low |
| Hot cell | Reads higher | Cool to 20 C | 0.01-0.05 V high |
| Aged cell | Curve shifts | Compare capacity | Varies |
| Surface charge | Reads high | Apply brief load | 0.1-0.3 V high |
⚙Formula Breakdown
💡Accurate Reading Tips
The second is a quick health check: You read the voltage on your battery and determine its state of charge. A calculator plots that one number onto known chemical curves for each battery type; with this, you gets a useful percentage. Each battery type has a unique relationship between its open-circuit voltage (when not connected) and its state of charge. The tool stores those relationships as breakpoints. It then use interpolation to estimate state of charge along with other values like remaining capacity and per-cell voltage, plus a status label from Full through Critical.
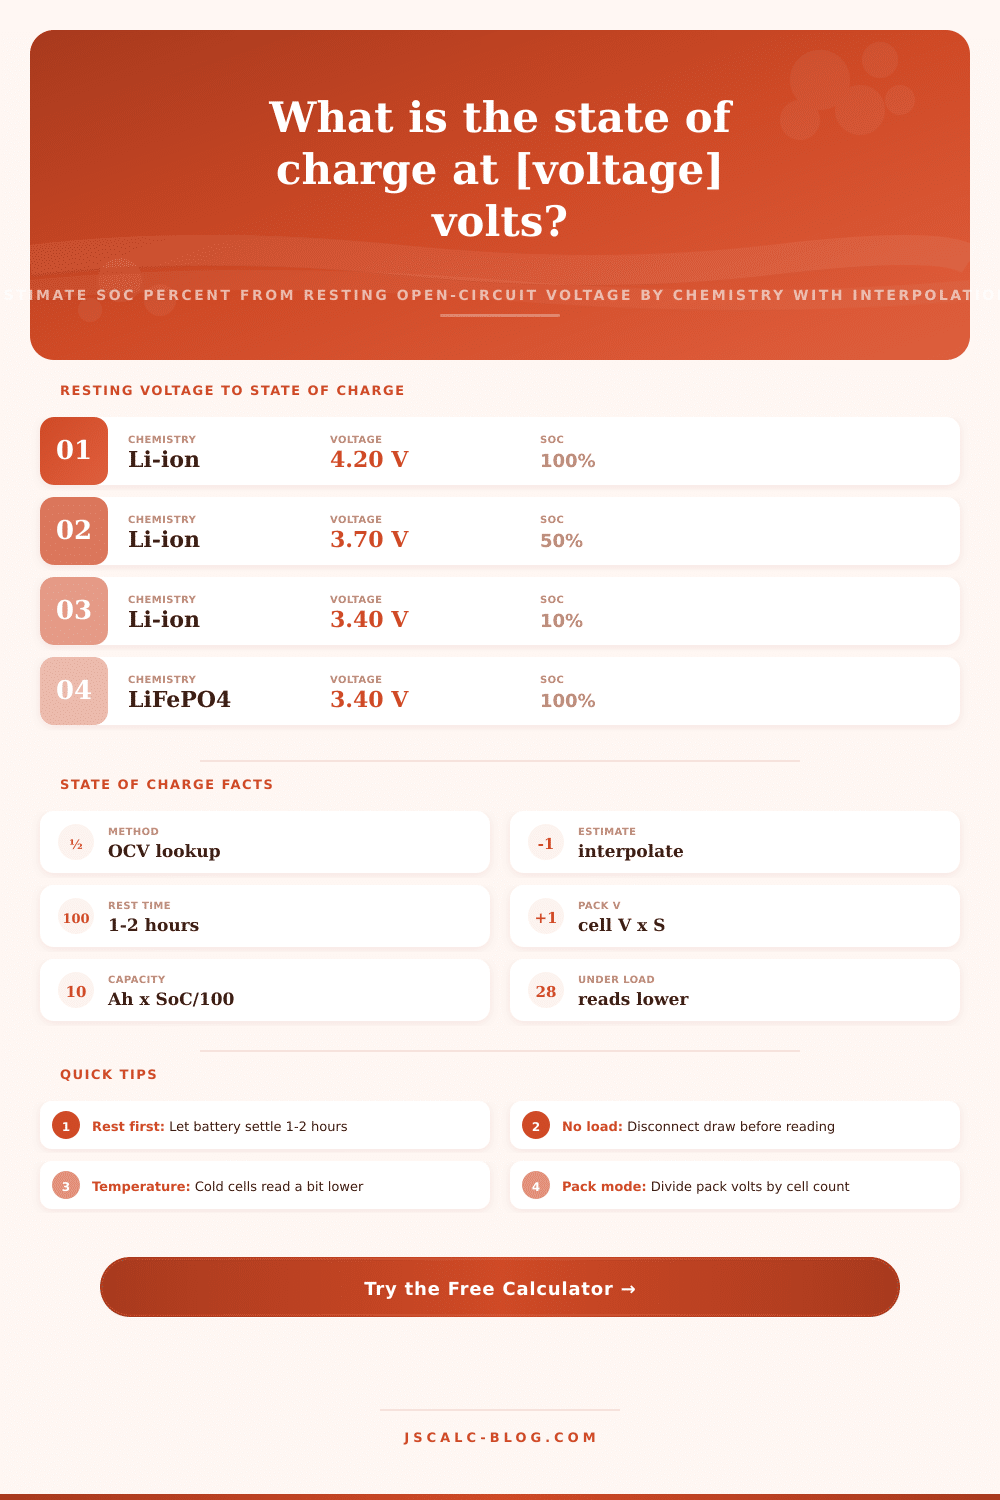
The chemistry reaches an equilibrium inside a resting cell, generating a constant voltage called the open-circuit voltage. This voltage connects with how much energy is stored in a predictable manner. A fully charged lithium-ion cell will rest near 4.20 volts; it’ll be about 3.70 volts when half-charged and sag down to 3.00 volts as it approaches emptiness. Other batteries such as lead-acid and LiFePO4 follow different lines of their own. These are the most popular chemistries, and the calculator has tables for them. It then puts your reading onto the appropriate portion of that batterys curve.
How the Calculator Works
The tool use linear interpolation to approximate a real discharge curve. This curve is not actualy a straight line. It uses the measured breakpoints as points. It looks for the two points closest to yours on either side… Above or below, that bracket your measurement, and calculates the percentage of charge based off their distance apart. So, in the case of a lithium-ion cell at 3.80 volts, it’s somewhere between 50 percent and 70 percent, close to 59 percent. The more breakpoints you use, the more closely the estimated curve will match the true shape of the actual curve.
Batteries are often connected in series, which allows for either whole-pack or single-cell input. For packs, you input the series number of cells and the overall voltage. It then split the total voltage across the number of cells and looks it up from there. For example, if your LiFePO4 pack is rated at 13.2 volts with four cell, it calculates 3.30 volts per cell. Why? Because lookup tables is defined per cell. It wouldn’t make sense to compare one cell’s curve to your pack voltage (which is higher). Making this conversion to per-cell first ensures the math stay accurate.
Four result cards get filled with each calculation. The top one is the estimated state of charge percentage. Next is the remaining capacity in amp-hours, calculated at rated capacity times that percentage. Next up is the per-cell voltage used for the lookup. And finally there’s a status label, assigned by thresholds, Full if over 80 percent; Good from 50 to 80; Low from 20 to 50; and Critical under 20. Additionally, a breakdown panel lists the bracketing points, so you can see exactly how the number was derived.
The most important thing to keep in mind is the resting voltage. Battery voltage will fall because of internal resistance whenever you draw current from it. Terminal voltage won’t rise back to its real equilibrium value until the load current stops. In other words, a reading while the battery is on load is lower than actual charge status. Immediately after charging, the situation reverses: artificial surface charge keeps the voltage high. Only if you remove any chargers or loads and wait an hour or so for the battery to settle will you have a reliable indication. A reading of 3.5 volts per cell under a heavy load may actualy mean the battery is at 60 percent once it settles down. Patience avoids premature false alarms.
The published curves are at temps around 20 to 25 degrees Celsius. At cold cell temp, the same actual charge reads a little low, meaning that a healthy pack may appear almost empty in winter. On the other hand, hot cells will read a little high. The calculator has a temperature selection to show this. Because LiFePO4 is known to have a fairly flat charge curve right through the middle band, care should of been taken with them in particular: A mere few hundredths of a volt difference can shift the estimate considerably. Take mid-range LFP estimates with a grain of salt; use current monitoring if you really need accuracy where it matters.
Common scenarios include 12.7 volts on a 12-volt lead-acid block or 3.80 volts on a lithium cell. These are filled out automatically. This fills in the form instantly and allows you to see that similar voltages are very different depending on chemistry. It’s handy then for car batteries, e-bike packs, and solar banks alike.
State of charge by voltage is not a laboratory measure, it’s an estimate. There is variation between individual cells due to manufacturing spread, and aging shifts these curves over time. Take this as a quick field check and a place to plan storage. Don’t treat it as anything more than a fast approximation if you require certified numbers. Use it along with proper monitors for those times. Still, reading state of charge from resting voltage remains one of the most useful skills in the battery owner’s toolkit. Treated as a fast approximation.