Battery Depth of Discharge Calculator
Work out depth of discharge as DoD percent equals used capacity divided by total capacity times 100, read the remaining state of charge, and find the usable amp-hours at a chosen DoD. Pick your cell chemistry and the tool warns when a target DoD goes past the safe maximum that protects cycle life.
⚡Choose What to Solve
🎯Real Battery DoD Presets
🔋Battery Inputs
Nameplate capacity of the full battery or bank.
Applies to total, used, and usable values.
Energy drawn out since the last full charge.
How deep you plan to cycle the pack each time.
Sets the recommended max DoD for the verdict.
Optional SoC buffer you never want to drop below.
Controls rounding on every result card.
🔢Formula Snapshot
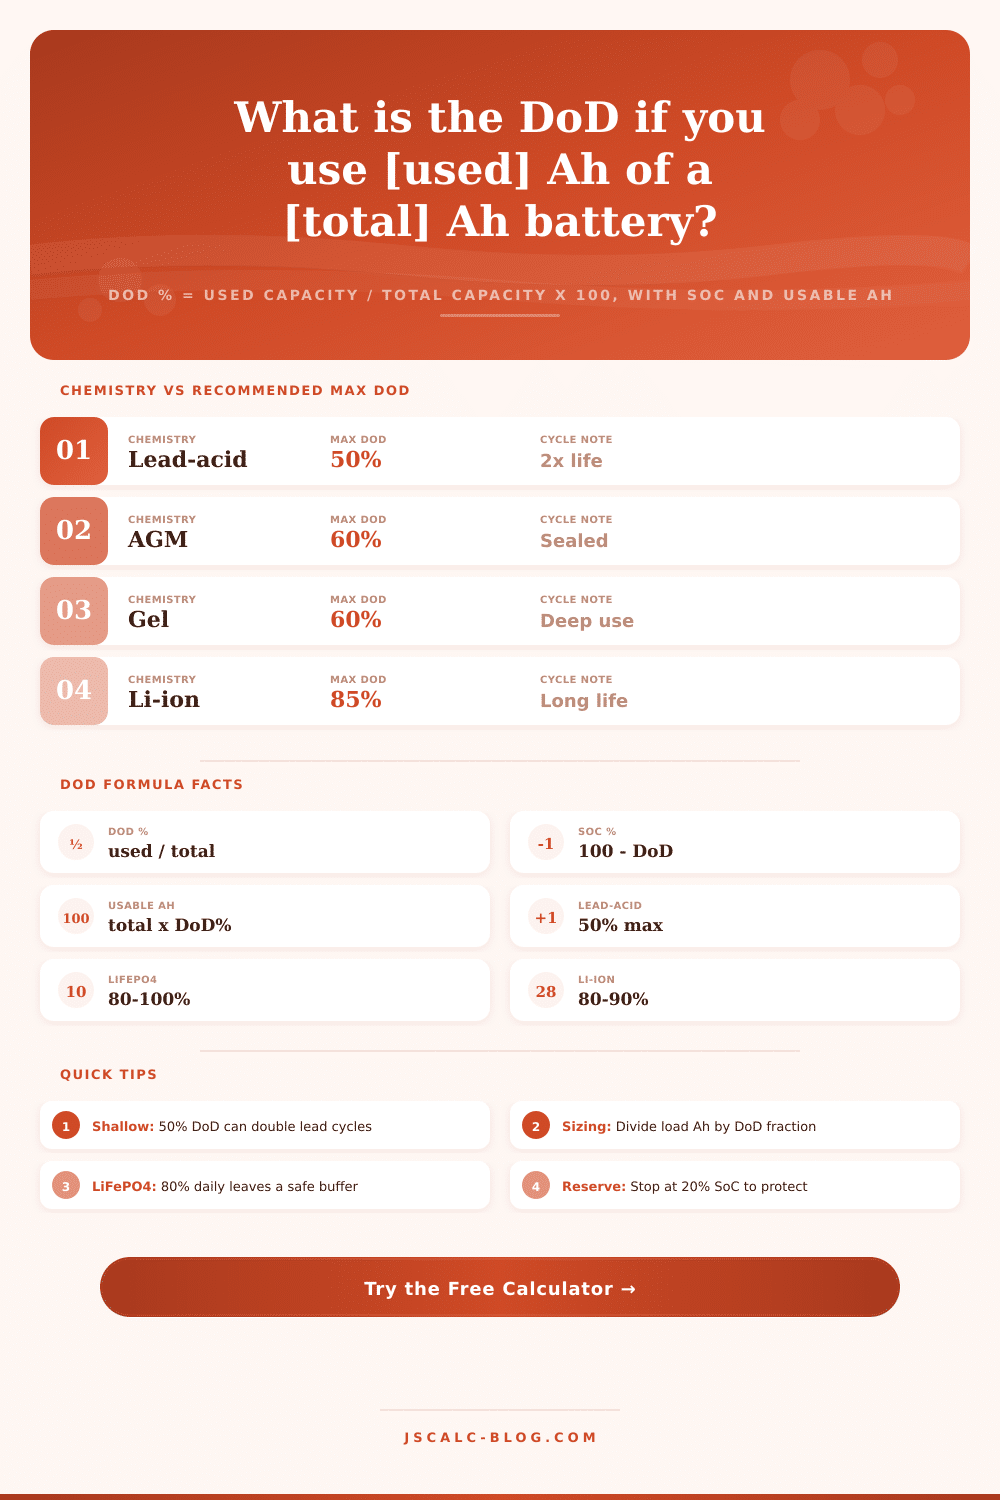
⚡Chemistry vs Recommended Max DoD
| Chemistry | Recommended Max DoD | Typical SoC Floor | Cycle-Life Benefit | Best Daily DoD |
|---|---|---|---|---|
| Lead-acid flooded | 50% | 50% SoC | Shallow cycling can double cycle count | 30-50% |
| AGM sealed | 50-60% | 40% SoC | Handles deeper draw than flooded | 50% |
| Gel sealed | 50-60% | 40% SoC | Good deep-cycle durability | 50% |
| Li-ion NMC | 80-90% | 10-20% SoC | Thousands of cycles at 80% | 80% |
| LiFePO4 | 80-100% | 0-20% SoC | Flat cycle loss even near full DoD | 80-90% |
| NiMH | 80% | 20% SoC | Moderate cycle life, tolerates deep use | 70-80% |
| NiCd | 90-100% | 0-10% SoC | Rugged, resists deep discharge damage | 80-90% |
| Carbon lead hybrid | 70% | 30% SoC | Better partial-state cycling than lead | 60-70% |
📊DoD to State of Charge Map
| Depth of Discharge | Remaining SoC | Used of 100 Ah | Left of 100 Ah |
|---|---|---|---|
| 0% | 100% | 0 Ah | 100 Ah |
| 20% | 80% | 20 Ah | 80 Ah |
| 30% | 70% | 30 Ah | 70 Ah |
| 50% | 50% | 50 Ah | 50 Ah |
| 60% | 40% | 60 Ah | 40 Ah |
| 70% | 30% | 70 Ah | 30 Ah |
| 80% | 20% | 80 Ah | 20 Ah |
| 90% | 10% | 90 Ah | 10 Ah |
| 100% | 0% | 100 Ah | 0 Ah |
🔌Usable Capacity at Common DoD Levels
| Rated Capacity | At 50% DoD | At 80% DoD | At 90% DoD | At 100% DoD |
|---|---|---|---|---|
| 50 Ah | 25 Ah | 40 Ah | 45 Ah | 50 Ah |
| 100 Ah | 50 Ah | 80 Ah | 90 Ah | 100 Ah |
| 200 Ah | 100 Ah | 160 Ah | 180 Ah | 200 Ah |
| 280 Ah | 140 Ah | 224 Ah | 252 Ah | 280 Ah |
| 1200 Wh | 600 Wh | 960 Wh | 1080 Wh | 1200 Wh |
| 2400 Wh | 1200 Wh | 1920 Wh | 2160 Wh | 2400 Wh |
| 5000 Wh | 2500 Wh | 4000 Wh | 4500 Wh | 5000 Wh |
📏Sizing a Bank for a Daily Load
| Daily Load | Chemistry | Max DoD | Rated Bank Needed | Rule |
|---|---|---|---|---|
| 50 Ah | Lead-acid | 50% | 100 Ah | load / 0.50 |
| 50 Ah | LiFePO4 | 80% | 62.5 Ah | load / 0.80 |
| 100 Ah | AGM | 60% | 167 Ah | load / 0.60 |
| 100 Ah | LiFePO4 | 90% | 111 Ah | load / 0.90 |
| 1000 Wh | Li-ion | 85% | 1176 Wh | load / 0.85 |
| 2000 Wh | LiFePO4 | 80% | 2500 Wh | load / 0.80 |
⚙Formula Breakdown
💡Depth of Discharge Tips
The battery depth of discharge calculator turns one of the most misunderstood specs into a clear number. This one clears up a confusing spec. Depth of discharge (DoD) is an indicator of how much a battery’s rated capacity was discharged. The other spec is state of charge. A depth of discharge of 40% means that your battery are currently at 60% state of charge. Knowing this relationship is key to determining if your battery bank will last a decade or die in a season.
Each battery chemistry has a max depth that shouldn’t regularly be exceeded. The depth of discharge refers to the percent of total capacity that has been removed. To determine this you simply divide the capacity that has been used by the total capacity then multiply result by 100. If you pull out fifty amp-hours from a one-hundred amp-hour battery, your depth of discharge will be fifty percent. That figure represents the rated capacity (which is what is written on the device).
What Is Depth of Discharge?
The calculator can handle both watt-hours and amp-hours as input. That’s important because some people like to keep tabs on their energy usage in watt-hours whereas other folks does so in amp-hours (for example for portable power stations vs a twelve-volt house bank). Whichever you prefer, the math behind it all is the same.
This tool lets you view the same event in three different ways that are described by three values: What have I used? Depth of discharge (DoD) How much is left? State of charge (SOC), which is always one hundred less your DoD. And finally, usable capacity, the amount of real energy I can safely pull out at any particular DoD. For example, a two-hundred amp-hour battery cycled down to an eighty-percent DoD has a usable capacity of one hundred and sixty amp-hours, plus a twenty-percent reserve. Because it shows you all three numbers at once, not just depth of discharge, you won’t mistake how far you’ve discharged the battery for how much power is still in there. That distinction saves batteries from accidental over-discharge.
It has two modes. One is for planning for a specific use case, where you plug in energy consumed and it outputs your remaining state of charge and DoD. This is useful for tracking batteries while they’re being cycled throughout the day. The second mode plans from the other side: you specify the maximum DoD you want from the pack, and it tells you what fraction of its total capacity is actualy usable at that point. This is useful for asking, “How do I size this? This helps you ask how much capacity you can rely on when designing for deep cycling.
There’s a chooser for battery type in both modes. Cycle life depends on chemistry. Lead-acid (flooded) batteries shouldn’t exceed fifty percent DoD very often. Eighty percent will cut their life span in half or more. Gel and AGM batteries last longer and can be discharged a bit further… Maybe up to 50-60% is reasonable. You can use lithium types really far down. Eighty to 90 percent is fine for standard Li-ion; LiFePO4 lasts a long time at 80-100%. NiMH batteries like to be used to about 80%; NiCd are tough customers at deep discharge levels.
The calculator remembers the maximum recommendation for each battery chemistry and will compare that to what you enter. Each calculation is summarized by four result cards: the remaining battery charge percentage and the DoD percentage (the first two). Usable capacity in the unit of choice (third). The fourth is a safety verdict, which evaluates how deeply you’re pulling compared to the recommended depth of discharge, based on the chemistry you’ve chosen. Are you safely above the limit? Below and drawing too deeply? If the latter, the status line cautions that further draws this deep will reduce battery lifespan. The fourth card includes all the numbers it used to arrive at its results. It also includes a breakdown of the formula so you can check the tool’s results against what you compute yourself.
Today’s shallow (30%) cycle will have less available capacity tomorrow, but it also means fewer total cycles before failure. The deeper (90%) cycle gets us more today, at the cost of aging some chemistries faster. The limits are in a table that you can reference, where each chemistry has a corresponding recommended maximum DoD and a typical state of charge floor. When you look them all together, it becomes apparent: there is a trade off between using up more today versus saving for later.
The rated capacity of the battery bank you need depends on both your depth of discharge and the amp-hours that you draw. For example: if you know how many amp-hours a day you draw (your load) and have a max DoD, then dividing your daily draw by the fraction representing your DoD will tell you how much rated capacity you need. Here is an example: With 50 amps used every night, limited to drawing half of your capacity (fifty percent limit for lead-acid), you’d require a one hundred amp-hour bank. The same load but running it down to eighty percent (LiFePO4 at an eighty percent limit) would need roughly just sixty-three amp-hours. That’s why your lithium bank can be smaller than an equivalent lead-acid bank, while delivering the same amount of actual energy. You’re using more of your nameplate capacity because of their greater safe depth of discharge.
Two habits protect almost any bank. Keep their battery charge levels high, and don’t let them discharge past halfway (treat only half the rated capacity as useable). Plan accordingly for Lithium batteries by running at ~80% depth of discharge with some reserve for surprise loads or cold weather. Optional Reserve Floor field allows you to preset a minimum state of charge that you never wish to go below. Use a default such as lead acid 50% state of charge rule or the LiFePO4 80% daily depth of discharge rule. Modify based on your specific hardware and inspect the outcome.
With accurate numbers fast, the battery depth of discharge calculator will remove guesswork in both small trolling motor packs and off grid solar banks alike. It creates a solid plan where none existed before.