Battery Cycle Life Estimator
Model how many charge-discharge cycles a battery pack delivers as a function of its depth of discharge and operating temperature, then translate that cycle count into a calendar lifespan in years and the total energy throughput in kilowatt-hours over the life of the pack.
🎯Real-World Cycle Life Presets
🔋Pack and Usage Inputs
Rated cycles are quoted at an 80% depth-of-discharge reference to 80% capacity remaining.
How deep each cycle drains the pack. Shallower cycling yields more cycles.
Full-equivalent cycles per day, used to convert cycles into calendar years.
Higher k rewards shallow cycling more strongly in the cycle-count model.
Rated amp-hours of the pack. Leave at 0 to skip throughput and cost figures.
Nominal pack voltage. Amp-hours times volts gives watt-hours per full discharge.
Heat accelerates aging. This derate factor scales the estimated cycle count.
Used only for cost per cycle and cost per kWh throughput. Set 0 to hide.
🔢Model Snapshot
📋Rated Cycles by Chemistry and DoD
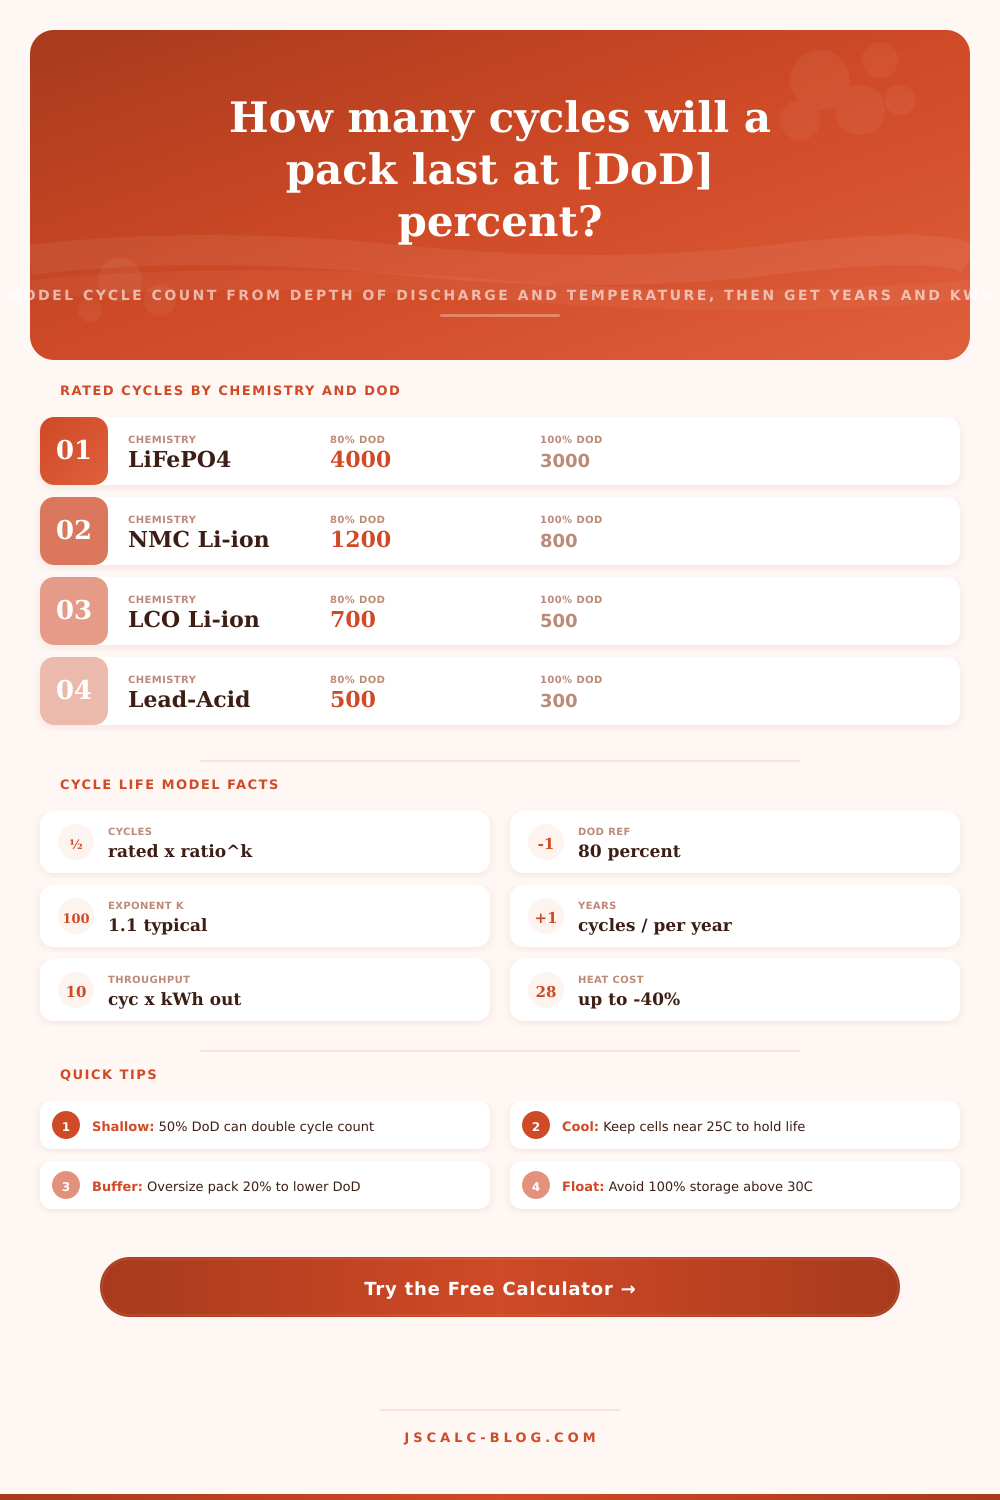
| Chemistry | Cycles @ 100% DoD | Cycles @ 80% DoD | Cycles @ 50% DoD | Round-Trip Eff. | Typical Use |
|---|---|---|---|---|---|
| LiFePO4 (LFP) | 3000 | 4000 | 6500 | 95% | Solar, storage |
| Li-ion NMC | 800 | 1200 | 2000 | 94% | EV, power tools |
| Li-ion LCO | 500 | 700 | 1100 | 92% | Phones, laptops |
| Lead-Acid flooded | 300 | 500 | 900 | 82% | Backup, off-grid |
| Lead-Acid AGM | 350 | 600 | 1100 | 85% | RV, marine |
| NiMH | 500 | 800 | 1400 | 80% | Hybrids, AA cells |
| NiCd | 1000 | 1500 | 2500 | 75% | Industrial, aviation |
| LTO (titanate) | 15000 | 18000 | 25000 | 96% | Grid, fast charge |
📊DoD Multiplier on Cycle Count
| Operating DoD | Ratio 80 / DoD | Multiplier (k=1.1) | LFP Cycles | Effect |
|---|---|---|---|---|
| 100% | 0.80 | 0.78 | 3120 | Deepest wear |
| 90% | 0.89 | 0.88 | 3520 | Heavy use |
| 80% | 1.00 | 1.00 | 4000 | Reference |
| 70% | 1.14 | 1.16 | 4640 | Balanced |
| 50% | 1.60 | 1.69 | 6760 | Long life |
| 30% | 2.67 | 3.03 | 12120 | Very gentle |
| 20% | 4.00 | 4.79 | 19160 | Trickle cycling |
🌡Temperature Derate Factors
| Temperature Band | Derate Factor | Cycle Effect | Note |
|---|---|---|---|
| 10C to 20C | 1.05 | +5% | Cool slows aging |
| 20C to 30C | 1.00 | Baseline | Ideal operating band |
| 30C to 40C | 0.85 | -15% | Noticeable fade |
| 40C to 50C | 0.70 | -30% | Ventilation needed |
| Above 50C | 0.60 | -40% | Rapid degradation |
| Below 0C charge | 0.65 | -35% | Avoid charging cold |
⚙Formula Breakdown
💡Cycle Life Field Tips
How many times will your battery pack be able to move energy around and last? How long? Datasheets include a cycle life rating as a starting point, but that’s just at one temperature and one depth of discharge. Change those two things, how hot your pack gets, or how deep you drain it, and your real-life cycle count could swing up or down by a factor of two or more.
This tool takes a single-rated value, then turns it into an estimate of the cycle count, calendar years, and total lifetime kilowatt-hours of your pack under your typical use.
How to Estimate Your Battery Life
There are many factors affecting cycle life; the single biggest thing you control is depth of discharge. That’s the percentage of capacity you pull off during a charge/discharge cycle. Pulling it down to 100 percent daily is far more stressful then pulling it down to 50 percent. Why? Chemically speaking, deep discharging maximizes the change in volume between electrodes. It also causes the growth of solid layer that gradually eats up active material. And cycle life is inversely proportional to DoD. Cutting the depth by half should result in two or more times the number of cycles before fade occurs.
Most manufacturers quote their headline cycle figure under an eighty percent reference (which is the anchor here). The estimator’s model expresses the cycles as a product of a DoD factor, a temperature factor, and a rated count. Then there’s that DoD factor. It is a ratio to an exponent k. You can think of the cycles being approximately equal to your rated count times (80 / DoD) to the power of k. The exponent represents the strength of the shallow cycling benefit. If you have 1.0, then it’s linear and conservative. But if you get to 1.2 or 1.3, then you’re capturing the stronger benefit that many lithium cells demonstrate in tests. For typical Li-ion chemistry, an average choice of 1.1 makes sense. With that exponent, fifty percent DoD increases an LFP pack rated at 4000 cycles to almost 6800. Why does that matter? Because not only is it safer to shallow cycle, it’s also much better, when it comes to extending the pack’s life, shallower is richer.
The other killer for battery life is heat. Every undesirable side reaction happen quicker at higher temps, so a pack stored at 45C will age significantly more quickly than one stored around 25C. The calculator models that with a reduction factor applied to the estimated number. At 1.0 (the middle, or mild band), you get no cut. At about 15 percent (the warm band), it is off by about fifteen percent. Over 50C, it will lop off up to forty percent. Because lithium plates when charged below freezing, this is likewise considered to be harmful, select your true operating band here so the estimate isn’t an overly optimistic one.
To calculate this in calendar years, divide the estimated number of cycles by the expected cycles per year (which is simply “full” cycles). For example, at one cycle a day, there are 365 cycles per year. With a 4000 cycle pack, that means an 11-year lifespan. If you want to get really accurate (including fractional cycles, i.e., part-of-a-cycle), enter your actual rate and the tool will spit back real-life number you can plan for.
But the best figure to use when comparing batteries is total energy throughput, and this is what the tool calculates. It takes the battery’s capacity, voltage, and fraction discharged. It also estimates the number of cycles. It multiplies these together to get an energy per cycle. So, for example, if you have a hundred amp-hour LFP pack running down to eighty percent (the discharged fraction), that’s about four kilowatt-hours per cycle. At over 4000 cycles, that’s more than sixteen thousand kilowatt-hours. Plug in your purchase price, and the estimator will tell you how much each kilowatt-hour costs, on average, or levelized cost per kilowatt-hour. Often this shows that a long-life chemistry costing more up-front is cheaper than a bargain pack that expires prematurely.
The cycle-life map has different corners populated with different chemistries. Solar storage’s workhorse chemistry, lithium iron phosphate, achieves about 3000-6500 cycles depending on how deeply discharged. Higher-energy-dense but slightly lower-cycle NiMnCo Li-ion chemistry is better suited to electric vehicles. Lead-acid delivers only a few hundred cycles and prefers shallow discharge, while nickel metal hydride sits in the middle. Lead-acid can handle a few hundred cycles but likes shallow discharge; NiMH is somewhere in between. Finally, expensive lithium titanate handles fast charging and lasts 15000+ cycles, so it shows up in grid uses.
The tool also serves as a calculation check since it shows formula breakdown behind every result, line by line with numbers replaced with their substitutes. It has some presets built in to load common real-world scenarios, such as a lead-acid battery backup system, an NMC electric-vehicle profile, or an LFP solar bank. Load one up and tweak its capacity, temperature, or depth of discharge to see what each knob does to move the kilowatt-hours, cycles and years. No need to do math yourself; the calculator above will handle it for you. It will also save you time with all those conversions and coefficients.
Use this as a planning aid only. Real longevity will depend on more than these two factors (cell quality, balancing, charge rate, voltage cutoffs). Take the output as a well-grounded estimate, take it seriously, but don’t treat it as a guarantee. We’re trying to understand cost per cycle in both energy and time, not simply counting them. Knowing the difference helps you build a system that lasts, rather than one that just looks good on paper.