Battery Charge Time Calculator
Estimate how long a battery takes to charge from your capacity, charge current, and the state-of-charge window you want to fill. The tool splits the job into a constant-current bulk stage and a constant-voltage taper stage, then reports total time and the energy delivered, adjusted for charger efficiency and chemistry.
⚡Real Charging Presets
🔋Battery and Charger Inputs
Rated capacity of the pack or cell.
1000 mAh equals 1 Ah.
Steady current your charger delivers in bulk.
Used to compute energy delivered in watt-hours.
How full the battery is before charging.
The fill level you want to reach.
Charge acceptance and converter losses combined.
Chemistry changes how slow the final stage is.
🔢Charge Snapshot
📋Charge C-Rate to Time (Full Charge)
| Charge Rate | Current on 100Ah | Basic Bulk Time | Typical Use |
|---|---|---|---|
| 0.1C | 10 A | Around 10 hr | Gentle lead-acid |
| 0.2C | 20 A | Around 5 hr | Solar and AGM |
| 0.3C | 30 A | Around 3.3 hr | Balanced LFP |
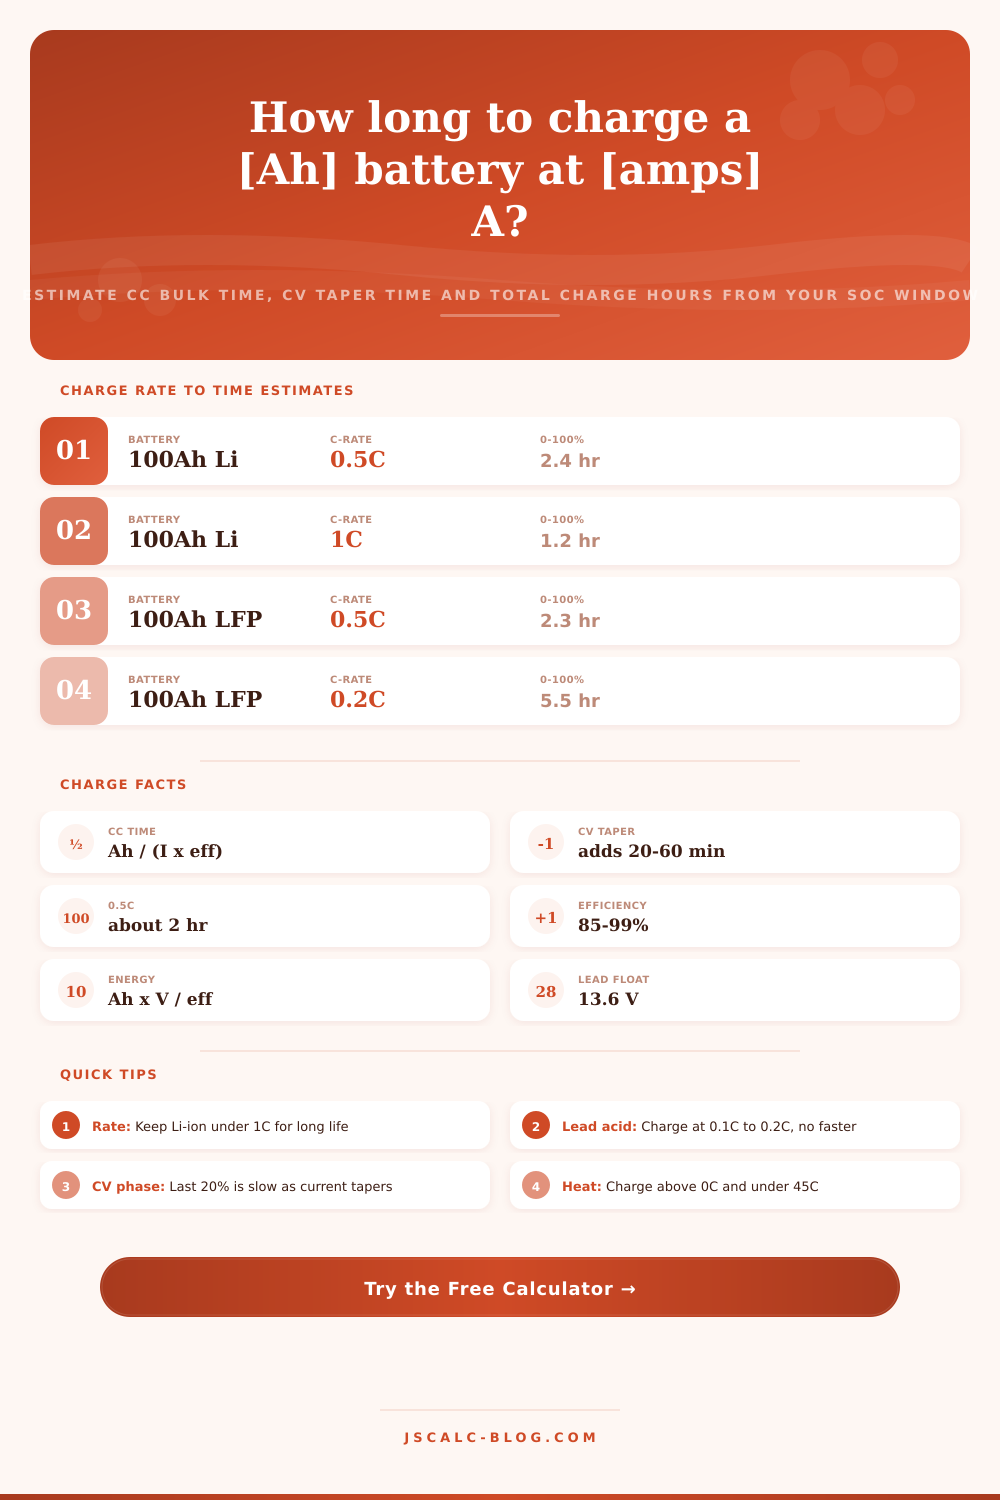
| 0.5C | 50 A | Around 2 hr | Standard LFP |
| 0.7C | 70 A | Around 1.4 hr | Fast LFP |
| 1C | 100 A | Around 1 hr | Fast Li-ion |
| 2C | 200 A | Around 0.5 hr | Small Li-ion cells |
🗃Chemistry Comparison Grid (Rate vs Time)
| Charge C-Rate | Li-ion to 80% | Li-ion to 100% | LiFePO4 to 80% | LiFePO4 to 100% | Lead-Acid to 100% |
|---|---|---|---|---|---|
| 0.1C | 8.0 hr | 9.5 hr | 8.0 hr | 9.0 hr | 11-13 hr |
| 0.2C | 4.0 hr | 5.0 hr | 4.0 hr | 4.6 hr | 7-8 hr |
| 0.3C | 2.7 hr | 3.4 hr | 2.7 hr | 3.1 hr | Not advised |
| 0.5C | 1.6 hr | 2.1 hr | 1.6 hr | 1.9 hr | Not advised |
| 0.7C | 1.1 hr | 1.5 hr | 1.1 hr | 1.3 hr | Not advised |
| 1C | 0.8 hr | 1.1 hr | 0.8 hr | 0.9 hr | Not advised |
| 2C | 0.4 hr | 0.6 hr | 0.4 hr | 0.5 hr | Not advised |
🔋Capacity and Unit Reference
| Device or Pack | Capacity | In Ah | Nominal Voltage |
|---|---|---|---|
| Smartphone | 5000 mAh | 5 Ah | 3.7 V |
| Laptop | 6000 mAh | 6 Ah | 11.1 V |
| E-bike pack | 14 Ah | 14 Ah | 36 V |
| Car SLI battery | 50 Ah | 50 Ah | 12 V |
| RV LiFePO4 | 100 Ah | 100 Ah | 12.8 V |
| Solar bank LFP | 200 Ah | 200 Ah | 12.8 V |
⚙Formula Breakdown
💡Practical Charging Tips
Whether you’re a van lifer or just own a phone, it happens to all of us: you’ve got to go right now, but your phone is only partially charged. How long will that last? What’s the real-world battery behavior? Rather than following simple math formula, moddern batteries actualy charge via two very different stages.
To understand these, we created this tool: It predicts the actual energy supplied by your wall charger based off your exact cell chemistry, capacity, charging current, state-of-charge window, and charger efficiency. It provides a reasonable estimate for total time as well as true amount of energy delivered. Planning replaces guesswork.
How Batteries Charge and Why It Takes Time
Dividing amp-hours by amps would be the tempting shortcut here. A 100-amp hour battery can take 50 amps. The math say two hours. It is good enough for planning roughly along the initial stretch. Batteries don’t take full amount up to the top, however. When approaching full capacity, the pack’s internal voltage increases until it matches max set on the charger. Incoming current drops and charging slows drastically. Any estimate made without accounting for this will be optimistic. Most of the waiting comes in that last part of the charge cycle.
Almost all chargers for lead-acid or lithium batteries use a constant-current constant-voltage profile. Charger pushes battery at a constant current until the battery reach a certain voltage, which results in smooth increase in battery voltage during the constant-current portion. That’s the fast efficient portion. Usually the fast phase ends when the pack reaches about 80% state of charge. When the pack reaches the ceiling voltage, the charger turns on the absorption phase, which holds the pack at that voltage while the current decreases. The absorption phase adds final bit of capacity. But since the current keeps shrinking to nothing, it takes longer and longer, taking much more time then the small amount of charge it actualy provides.
The above calculator divides this into pieces by calculating how much it will take to return (from your start level) to whatever target level you set. On a 100 amp-hour pack, returning from 20% to full is an 80 amp-hour return. So the part down to that point is treated as fast, constant-current bit. Then the time spent on that is calculated at your chosen efficiency and current setting. For everything past 80%, it applies a chemistry-dependent multiplier to stretch out the time so it reflect how the current is dropping off. And finally, the total time is sum of both those parts. This gives you a far better sense of how the time is split up, which a simple division can not do.
This equation comes down to chemistry. A short taper and a flat voltage curve mean it happily accepts moderate current right up to capacity. That’s the case with LiFePO4. It tapers more than standard lithium-ion, but that adds a few minutes to the end of the charge cycle. The long inevitable absorption stage means lead acid is an outlier here. Because pushing high current into lead plates causes chemical damage. The tool embeds those differences in the equation. You can see how much switching chemistries affects the estimated charge time. This makes it clear why slow charging makes sense with some of them.
The C-rate is how charge current is commonly stated. It’s simply the number of Amps times the number of hours in the Amp-Hour rating of the pack. If your battery is rated for 100 Ah, you’re charging it at 0.5C with 50 amps and 1C with 100. Charging batteries slowly is kinder to the life of the cells. Even though many lithium packs will take higher rates during short bursts (as listed in the datasheet), most are happiest being run at or below 0.5C everyday. Lead-acid should generally be kept between 0.1C and 0.2C to avoid heat damage. The common rates is laid out in that table on the page. A slower rate saves life of the battery, but it extends the time required over hundreds of cycles.
In the real world, no charger is perfect. In fact, some energy you draw from the wall becomes heat in the converter and inside cells rather than stored charge. And then there’s imperfect charge acceptance. Lead-acid especially, can only hold (eighty) percent of incoming energy. Efficiency lengthens the time estimate to account for those losses. Then it drives the energy result in watt-hours. That’s telling you how much you’re really paying for at the socket. How much of your electricity will be turning into warmth instead of range.
You see results by looking at all four output cards. They show wall energy drawn, total duration, taper time and bulk time. How did they compute those? By looking at the breakdown panel, which displays what your input parameters created. Take it for what it is: a well grounded estimate not a readout of a stopwatch. Actuals will vary with battery age, temperature, and the management system’s attempt to keep current from getting too high or too low. For example cold batteries charge more slowly, and heat forces some chargers to throttle back. Nonetheless, splitting bulk charging into a fast stage followed by a longer, slower taper and including charging efficiency gets you much closer to real world than pure guesswork can. This works whether you want to size a solar array for a remote cabin or just plan out a top up overnight.