Glass Delta Calculator
Estimate Glass’s Δ from two-group summary statistics, using the control standard deviation as the denominator. Add an optional large-sample CI, then compare the same result with Cohen’s d and Hedges’ g.
🎯Named Research Presets
📝Group Summary Inputs
Direction changes the practical interpretation, not the raw signed effect.
Uses a common summary-data SE approximation for standardized mean differences.
Post-test, intervention, exposed, or experimental group average.
Baseline comparator, usual-care, placebo, or untreated group average.
Glass’s delta divides by this SD only.
Used for Cohen’s d, Hedges’ g, and SD imbalance checks.
Needed for pooled SD, Hedges correction, and CI width.
The control n also drives the Glass denominator uncertainty term.
🔢Current Effect Snapshot
📐Glass Delta Interpretation Benchmarks
| |Delta| Range | Common Label | Practical Reading | CI Check | Reporting Note |
|---|---|---|---|---|
| 0.00–0.09 | Trivial | Difference is tiny relative to control variation. | Likely fragile | Report exact value and context. |
| 0.10–0.19 | Very small | Detectable but usually modest in practice. | Check precision | Avoid strong language without context. |
| 0.20–0.34 | Small | Common minimum effect-size benchmark. | CI should exclude 0 for confidence. | Explain the outcome scale. |
| 0.35–0.49 | Small to medium | Often meaningful when outcomes matter. | Look for narrow interval. | Compare with domain norms. |
| 0.50–0.79 | Medium | Clear shift of roughly half a control SD. | CI width can still matter. | State direction and denominator. |
| 0.80–1.19 | Large | Strong separation from the control group. | Check sample-size leverage. | Inspect SD imbalance. |
| 1.20–1.99 | Very large | Major standardized difference. | Outliers may dominate. | Verify summary statistics. |
| 2.00+ | Extreme | Rare in noisy human or field data. | Audit measurement range. | Show raw means with effect size. |
⚖Effect Size Comparison Grid
| Metric | Formula | Denominator | Best When | Changes With SD Imbalance | Small-Sample Bias |
|---|---|---|---|---|---|
| Glass delta | (Mt - Mc) / SDc | Control SD only | Treatment may alter variability. | Stays anchored to control. | Usually reported uncorrected. |
| Cohen d | (Mt - Mc) / SDpooled | Pooled group SD | Groups have similar variances. | Moves toward larger SD group. | Upward in small samples. |
| Hedges g | J x Cohen d | Pooled SD plus J | Small or moderate samples. | Same denominator as d. | Bias-reduced by J factor. |
| Mean difference | Mt - Mc | Original outcome units | Scale is easy to interpret. | No SD effect. | No standardization bias. |
| Response ratio | Mt / Mc | Control mean | Positive ratio-scale outcomes. | Unaffected by SD. | Can be skew-sensitive. |
| Percent change | (Mt - Mc) / Mc | Control mean | Business or biological metrics. | Unaffected by SD. | Unstable near zero means. |
| Standard error | sqrt terms | n and delta | CI planning and meta-analysis. | Wider if control n is small. | Approximation only. |
| z test of delta | delta / SE | Approx SE | Rough signal check. | Reflects CI assumptions. | Not a full model test. |
🧪Glass Delta Scenario Examples
| Scenario | Treatment Mean | Control Mean | Control SD | Glass Delta | Plain Reading |
|---|---|---|---|---|---|
| Reading intervention score | 78.4 | 70.1 | 12.5 | 0.66 | Medium improvement |
| Reaction time training | 420 | 455 | 60 | -0.58 | Faster if lower is better |
| Blood pressure trial | 128 | 136 | 11 | -0.73 | Meaningful reduction |
| Memory recall items | 22.1 | 19.6 | 4.2 | 0.60 | Clear positive shift |
| Anxiety score program | 18.3 | 23.7 | 7.8 | -0.69 | Lower score benefit |
| Conversion metric test | 5.8 | 4.9 | 2.0 | 0.45 | Small to medium lift |
| Strength coaching load | 102 | 91 | 18 | 0.61 | Medium performance gain |
| Lab assay response | 14.8 | 11.2 | 2.4 | 1.50 | Very large shift |
📊Confidence Level Multipliers
| CI Option | z Multiplier | Interval Width | Typical Use | Caution |
|---|---|---|---|---|
| 90% | 1.645 | Narrower | Exploratory screening | Less conservative |
| 95% | 1.960 | Standard | Most reports and tables | Still approximate here |
| 99% | 2.576 | Wider | High-confidence summaries | Needs larger samples |
| No CI | none | Hidden | Quick effect-size check | Do not imply precision |
| Bootstrap CI | data-based | Variable | Raw data available | Not possible from summary stats alone |
| Model-based CI | model-based | Variable | Regression or mixed models | Must match study design |
⚙Formula Breakdown
💡Glass Delta Reporting Tips
When reading experimental results expressed as raw numbers, it’s hard to know how to interpret them without context. The means were different; ok. But did it make a meaningful diffrence? If a test typically varies by two points and you gained five points that’s something. If a test normally swings fifty points then five isn’t anything. Raw comparisons dont tell the whole story.
To get the complete picture, we have to compare the difference to the normal variation found in the system. That’s where effect sizes comes into play. One kind of effect size is Glass’s delta. Cohen’s d is familiar to many researchers. It calculates the mean difference divided by a pooled standard deviation. That combines the spread of control group with the spread of the treatment group. That makes sense if both groups acts similarly.
What is Glass’s Delta?
But what if an intervention alters the consistency of outcomes? What if a drug lowers your blood pressure but also causes erratic readings? If we used Cohen’s d, that inconsistency would factor into our denominator. This could reduce effect size and mask the effectiveness of the drug. Glass’s delta doesn’t have this problem. It ignores the variability in the treatment group. Instead, it relies solely on standard deviation of the control group. This preserves the baseline. The mean difference clearly communicate the results.
No fancy software required for this calculation. Simply input the standard deviations and means of the groups into the calculator and it calculate for you. No messing with coefficients or conversions. Know what you’re putting into it. What are those numbers? What does the control standard deviation represent? That’s the “normal” performance when no intervention occurs.
So, a large control standard deviation might indicate that the mean for the treated group is significantly different (higher) than the mean for the control group, but that delta is small. The tool reports both Hedges’ g, Cohen’s d, and Glass’s delta. Use these to call out differences. A much larger Glass’s delta then Cohen’s d suggests an increased variance within the treated group. Such variance could hide the actual mean shift.
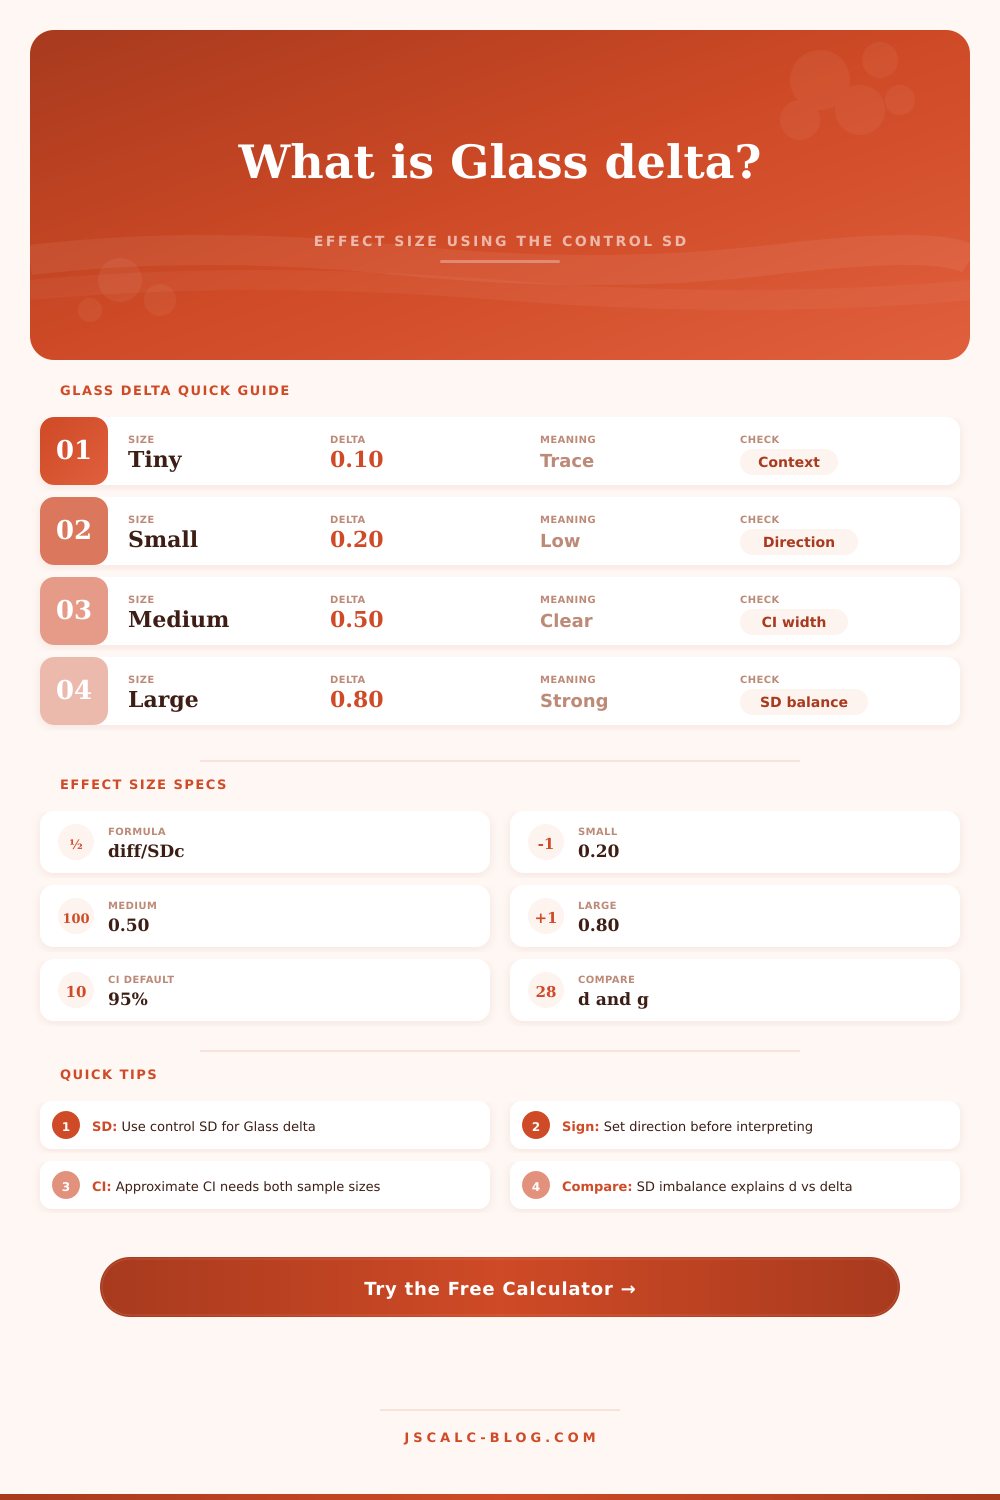
You can interpret the benchmarks this way: “Small” is roughly defined as 0.2 delta. Medium is about 0.5 delta. These aren’t hard-and-fast guidelines but points of reference to share when talking about impact. If your samples are small, then keep in mind your confidence intervals. Based off large-sample assumptions, the tool estimates rough intervals. That means you can see how precisely your estimate is. A narrow interval mean confidence in the signal, while a wide interval means you should of get more data. Yes, the number matters. But so does the certainty you feel about that number.
Failing to consider the direction of the result is another pitfall. In certain areas like anxiety, lower is better, and the same goes for reaction time. Sometimes a negative delta is a good thing. Be sure to watch out for signs when interpreting results. The table of reports make it obvious. Whether a change is good depends on context.
A large delta might look impressive. But if the control standard deviation includes a lot of outliers that skew it, then the big number could just reflect measurement error. Glass’s delta focuses on stability of the base case. It measures the delta against the current state. It doesn’t normalize (average) by the noise in each group. That’s relevant for dynamic interventions. You can isolate the mean shift relative to the variance change. That paints a clearer picture of direct impact. Success isn’t diluted by the chaos the treatment causes. You’re anchoring your expectations to the control group. The true story lies in the mean difference.